ABSTRACT
Introduction
Goals and Objectives
The object and purpose of the study
Alleged scientific novelty
Review existing systems
Methods of research
Conclusion
Sources
Twenty-first century has brought an undeniable progress in all spheres of human life, from creative space discoveries in the search for new clean energy and ending with new types of destructive unknown diseases. Therefore, the main medical problem was as much as possible early detection of pathologies in order to give doctors time to conduct research and proper treatment. And most early diagnosis - diagnostics at the lowest level of organization, namely the cell.
But as you know, the most important tasks is difficult to meet. Every day new techniques for processing images of histological sections appear in the world, studied the morphological features of differentiated cells, improved microscopes and software to work with images on personal computers. The work of scientists biochemists also does not make a long wait, and continuously improve the process of immunohistochemical analysis - the method of detection and precise localization of a cell or tissue component (antigen) in situ by using immunological and histochemical reactions.
The main problem in creating an automated system of diagnostics of human diseases based on immunohistochemical analysis is the accuracy of identifying the cells and determine its parameters.
Therefore, the development of such computer system, which can assist physicians in setting the maximum accurate diagnosis while reducing the amount of time is an important and urgent task.
The aim of this work is to develop an automated subsystems to diagnose various diseases of the person on the images of histological sections obtained with a digital microscope, and the continuation of immunohistochemical staining.
To achieve this goal it is necessary to solve the following tasks:
Search and evaluation of the accuracy of existing methods for image processing microtomy;
Develop an algorithm for determining the pathological features of the cells on the images of histological sections;
Selecting the most appropriate method to achieve the stated objectives;
Implementation of the selected methods on a computer.
The research focused on the processing and recognition of objects in the image. The object of the study are color images of histological sections, obtained by digital microscopy and immunohistochemical staining. The subject of the study are the algorithms for segmentation, morphological operations and the allocation of objects in histological sections.
The main innovation is the use of different algorithms and methods for processing images of histological sections for the most accurate analysis, the methods of foreign scholars who were not previously applied in our country. Comparison of the results obtained allow to conclude on the status of the tissue sample and to evaluate the accuracy and speed of each of the approaches.
The developed software to be used in clinical laboratories «New Diagnostics» with Gusak INVH for the diagnosis of human diseases, mainly neoplasms of various organs.
FemtoScan Online - software package for the management of scanning probe microscopes and image-processing probe microscopy. The program runs under the operating systems Windows. To connect to the server using the protocol TCP / IP, which allows you to connect to the server, not only on the local network, but also through the Internet. All scanning parameters, user-defined, are transferred to the server and more - in the microscope and other users connected to a client. After starting the scanning process opens a window in which the real-time results are displayed - from the image size, scanning mode, the parameters of the feedback, the current position of the probe, the scanning speed. At the same time, the user can process the received data, using a wide range of different functions that are included in the program. The program, the client has a variety of functions for processing and image analysis probe microscopy: inversion, Wiener filter, transposition, analysis of the roughness, threshold filtering, the selection of grains, selection borders, morphological filters, etc.
The result of cell counting is shown in Fig. 1.
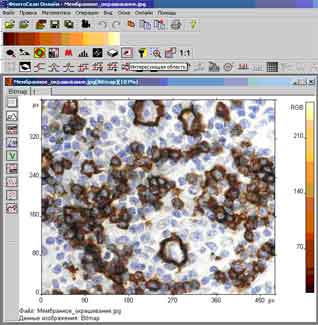 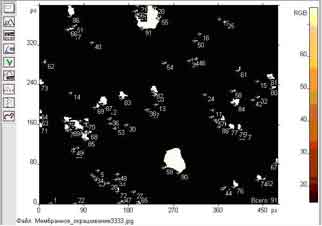
Fig.1. Contouring and counting cells in microtomy.
AnalySIS - a software company analySIS Five provides an analysis of the image. The program interface is shown in Fig.2.
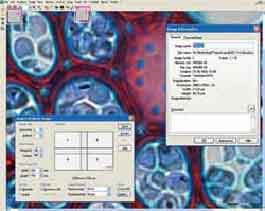 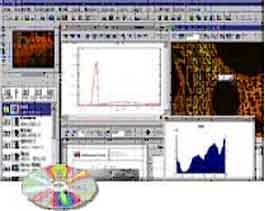
Fig. 2. View window AnalySIS
The program is implemented analySIS Five concept of - a single file (windows) in a box that contains the image of the analysis (table measurements, the histogram).
The program allows you to automate the capture of images, all set the camera, made by the user when setting is automatically saved and used in the following images to be removed. Support TWAIN devices joint injection. The software allows you to put the graphic elements on the image and perform the manual measurements in the live video. All features Image editing (drawing graphics and text, applying the calibration markers) and all the usual functions of converting the images included in the program. The manufacturer also claims the existence of the program unique filtering capabilities, such as a, for example, the filter differential enhancing contrast (DCE - Differential Contrast Enhancement) to optimize the contrast of the image (grayscale or color). Another of the useful features: pictures staple that allows removing the related field of view on a large increase, to combine them into one image. As well as feature that allows you to receive a sharp image from a series of visual fields, taken at different depth of focus (function Extended Focal Imaging). The history of image processing is saved and can be viewed.
1. Immunohistochemistry methods of study. The rapid development of immunology has led to the development of a new method for histological study - immunohistochemical.
Immunohistochemistry - a method of detection and accurate localization of a cell or tissue component (antigen) in situ by using immunological and histochemical reactions. The authors of this method is rightly considered to be a group of researchers under the leadership of Albert Koons, who first got flyuorestseinom labeled antibodies and used them for diagnostic purposes, were also developed techniques of direct and indirect immunofluorescence. However, the method has not received the high prevalence of the great difficulty of obtaining antibodies to visualize the complexity and low reproducibility. Subsequent years were marked not only the improvement of the method, but also to widen its scope. Were opened avidin and biotin, forming a stable complex, the methods of conjugation of antibodies with biotin, avidina - with enzymes, new methods for obtaining purified antibodies. All this has led to the widespread introduction of this method, first in research centers, and then in practical medicine. Immunohistochemistry methods of research to date is a mandatory part of any research, because they only provide the specific visualization of certain substances.
Using this method it is possible to determine localization in tissues of various cellular products (hormones, enzymes, immunoglobulins), the components of cells (receptors, contractile and intermediate filaments), and even individual genes.
Table 1. Imaging antigen of the most well-known firms
| Method | Company/system | Notes |
| Initially-labeled antibody (by enzymes or fluorochrome) |
Many |
The number of such antibodies is large. Rarely used in immunohistochemistry, but widely in flow cytometry. |
|
PAP- č APAAP-method
|
DAKO PAP kit
DAKO APAAP kit
|
The method is based on the peroxidate-antiperoxidate compound or phosphatate-antiphosphatate complex.
|
|
ABC-method
|
Novocastra Novostain Super ABC kit
VextorLab VectraStain ABC kit
|
The method is based on a set of avidin-biotin-enzyme
|
|
SaBC-method
|
DACO LSAB, LSAB+, LSAB2
Biogenex Super Sentitive Link-Label IHC
Detection Systems (Biotin Based)
Zymed Histostain-SAP Kit
Zymed Histostain-Plus Detection Kit
Chemicon IHC Select Detection Kits
|
The method is based on a set of streptavidin-biotin-enzyme
|
|
Polymer Technology with primary antibodies
|
DAKO EPOS
|
The method is based on dekstranovoy molecule, linking up to 20 primary antibodies and up to 100 molecules of enzyme
|
|
Polymer Technology with secondary antibodies
|
DAKO EnVision, EnVision+
Biogenex Super Sensitive Polymer-HRP IHC
Non-Biotin Detection System
ImmunoVision PowerVision
Zymed SuperPicTure Polymer Detection Kit
|
The method is based on dextran molecule, linking up to 20 primary antibodies and up to 100 molecules of enzyme
|
|
The method of amplification with biotin-tiramid
|
DAKO CSA
ImmunoVision ImmunoMax
|
The method is based on a set of streptavidin-biotin-enzyme complex and enhancing tiramid-biotin
|
|
The method of amplification with tiramid-fluoretsin
|
DAKO CSA II
|
The method is based on a set of streptavidin-biotin-enzyme complex and enhancing tiramid-fluorotsin
|
Imaging of histological sections used for immunohistochemical analysis, namely the definition of tissue components by means of unsupervised classification and clustering. Using the spatial distribution of pixels associated with positively and negatively charged cells, defined by painted model. At the same time, analyzed and spatial distribution of DNA-containing pixels.

Fig.3. Stages of image processing microtomy (animation 143 Kb, consisting of 105 images, made in ImageReady).
2. Methods for image processing.
2.1. The adaptive method of setting thresholds and segmentation.
Segmented image is computed via a threshold on the gradient image, which is calculated from the original image.
The gradient image is calculated using the method of Prewitt.
The original image is filtered using two masks, one for each direction, where each mask amplifies the differences in the corresponding direction.
Filter of Prewitt defined by a matrix
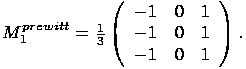
Filters approximating operator derivative of y-coordinates
 , are obtained by transposition of matrices. , are obtained by transposition of matrices.
This leads to two new images, Ix and Iy, each of which is a boundary pixel variations in the X and Y directions, respectively. After that, we put that

for the location of each pixel. Pixels with a gradient above a certain threshold value of  will now be marked as the area of the foreground. will now be marked as the area of the foreground.
A crucial role in the segmentation step is to automatically find a threshold .
Gradient values are set by Rayleigh distribution function,

where  is a parameter that is varied until the best match is not found, and X - the value of pixel. The meaning of this procedure is that the gradient value of pixels the image will be distributed according to the law of Rayleigh, in accordance with the assumptions that such values of Ix and Iy are identical, independent, and are usually normal (according to the law of Gauss) distributed. To obtain the final segmented image, we apply the morphological opening and closing with a circular structure of radius of 4 pixels. The result is illustrated in Fig.4. is a parameter that is varied until the best match is not found, and X - the value of pixel. The meaning of this procedure is that the gradient value of pixels the image will be distributed according to the law of Rayleigh, in accordance with the assumptions that such values of Ix and Iy are identical, independent, and are usually normal (according to the law of Gauss) distributed. To obtain the final segmented image, we apply the morphological opening and closing with a circular structure of radius of 4 pixels. The result is illustrated in Fig.4.
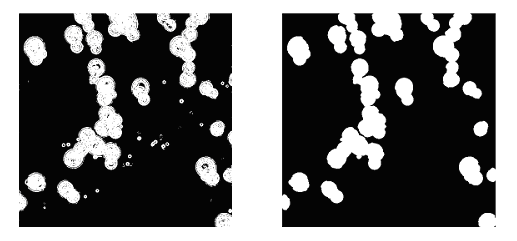
Fig.4. The result of image segmentation
2.2. Median filter
The median filter implements the procedure for the suppression of nonlinear additive and impulse noise in the image. Median filter is a moving picture window on the field, W, covering an odd number of times. Head count is replaced by the median of all elements of an image caught in a window. Median discrete sequence x1, x2, ..., xL for odd L is called a part of it, for which there are (L - 1) / 2 elements less than or equal to it in size, and (L - 1) / 2 elements, large or equal to it in size. In other words, the median is the middle member of a number of order, resulting in the streamlining of the original sequence. For example, med (20, 10, 3, 7, 7) = 7. Two-dimensional median filter with window W is defined as follows:

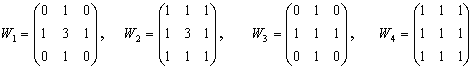
Among the 3x3 median filter dimension are most prevalent include:
2.3. Finding candidate cell centers
Since each connected component in the segmented image represents the total cells, these aggregates should be separated into individual cells. This is achieved by using the search function on the segment of a circle along the outer contours of objects in the segmented image, using variations of circular Hough’s transformation. This principle is shown in Fig.5.
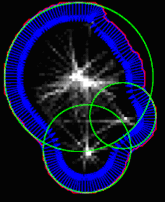
Fig.5. The result of applying the transformation of Hough.
When going around the outer edge of the connected regions in the segmented image approximating normal to the boundary is calculated at each point. Along each normal, we go step by step inside and record the distance to the point of the respective borders. Thus, the accumulated matrix so formed, where each element includes a number of "hits" on the normal to the boundary and tracks the appropriate distance. When each point along the border together, cells were passed, we are looking for the location of the maximum in the accumulated matrix. The resulting circle in Fig.5 are displayed in green. Community centers will serve as a candidate for the centers of cells to obtain the final circuit.
2.3.1. Circular Hough’s transformation.
The cells are round. The circle can be represented as

This model consists of three parameters: two parameters in the center of the circle, and one parameter for the radius of the circle. If there is a slope angle at the edges, it is a deterrent that reduces the number of degrees of freedom and, therefore, required size of the parameter space. The direction vector from the center of the circle to the edge of each point determines the angle of the gradient, resulting in values of radius, as the only unknown parameter.
Thus, the parametric equation of a circle in polar coordinates:

Solving for the parameters of the circle, we get the equation:

Now given the gradient angle  at an edge point (x,y), we can compute sin and cos. Note that these quantities may already be available as a by-product of edge detection. We can eliminate the radius from the pair of equations above to yield : at an edge point (x,y), we can compute sin and cos. Note that these quantities may already be available as a by-product of edge detection. We can eliminate the radius from the pair of equations above to yield :

2.4. Cell contour extraction using dynamic programming
Each closed sequence of connected pixels around the center of the alleged cell, and hence the space of possible contours is enormous. To resolve this problem, the method presented in this reference system in the form of polar plots for each candidate at the center of the cell. Figure 6 shows the directional derivatives of the IX and Iy in the form of M = 32 rays emerging from the center of the alleged cell, where each beam at the selected N = 30 uniformly distributed radial locations. The true boundary cells adjacent to the dark «fringe» around the cells. Formally,
F (R,  ) denotes the point of the contour of the criterion function, ie at a distance R and angle
is the contour point. The angle is delayed counter-clockwise. ) denotes the point of the contour of the criterion function, ie at a distance R and angle
is the contour point. The angle is delayed counter-clockwise.

Cosine and sine operations correspond to the projection data along the rays.
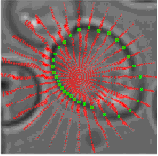
Fig.6. The contour of the cells obtained by using dynamic programming.
The value of S (P) for the circuit or a path P = (P1, P2 ,...,), found from left to right is:

The optimal path P *, this is the path that minimizes the amount of S (P). In the course of the algorithm is necessary to conduct the following computation:
Initialization (m = 1):  Recursion (Ě = 2, M): for each i = 1,. . . , N calculate the current optimal cumulative cost
and save the pointer to the corresponding minimizer:
 Termination: The minimal cost is

and the last state of the corresponding path is
 Traceback: The full optimal path is found by backtracing using the pointer matrix P: For M = M,. . . , 2

From the said material we can make an infer about the prospects for CS in the use of modern medicine. Development and application of diagnostic systems, new algorithms will improve the speed and accuracy of information processing in these systems by several orders of magnitude.
1. Fundamentals of immunohistochemically
http://www.newdiagnostics.dn.ua/index.php?option=com_content&task=view&id=18&Itemid=17&&lang=ru
2. Automated recognition of cell phenotypes in histology images based on membrane- and nuclei- targeting biomarkers
http://www.biomedcentral.com/1471-2342/7/7
3. Image analysis algorithms for cell contour recognition in budding yeast
http://www.opticsinfobase.org/DirectPDFAccess/351802CD-BDB9-137E-C9C3F4794EF34E6D_170494.pdf?da=1&id=170494&seq=0&CFID=37376861&CFTOKEN=71773669
| |