


Abstract
My master's work is devoted to developing method of spectral analysis of geological explosion sound, conducted in a laboratory test. The choosen mathematical method is widely used technique of wavelet transform.
The object of research is results of the experiment. The device used for its performing is shown in Figure 1.
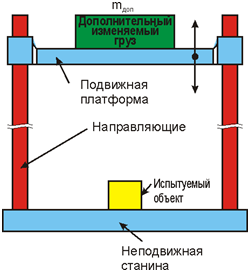
Figure 1. The sketch of the laboratory device
A movable platform of a certain mass falls on the test substance from a certain height. As a result detonation of the substance can occur. A researcher captures this fact. Fixing the fact of substance detonating is currently fixed subjectively. For example, visually or by the nature of sound. The problem is that the factor of subjectivity in determining the fact of detonation doubts the results of the research. Development of methodology for spectral analysis of the sound is conducted to objective fixing the results of the experiment.
The challenge is to obtain the spectrum of geological explosion sound and the allocation of frequencies that characterize the explosion as physical process. It is necessary to formulate the mathematical criteria that will reliably determine whether the explosion occurred or not to create some software that can automatically record the result of the experiment.
Spectral analysis of signals of different nature has been interested in academics for a long time. There are numerous articles on speech recognition, medical signal analysis, the application of spectral analysis in geology in the Internet. Several articles on this subject was made in DonNTU. For example, A. Stolyar has developed a hardware-software complex for diagnostics of cars. In this work, signals obtained from vibration sensors are used as source data. The interest of scientists to spectral analysis in the CIS countries and in the U.S. and Europe could be explained by the fact of usefulness of this powerful mathematical tool to process large volumes of data and detect patterns in them using powerful computational resources that can get information about the rapidly changing environments. Overwhelming number of works are related to the wavelet transform, a new mathematical apparatus, the essence and advantages of which are considered further.
Spectral analysis of signals is based on the fact, that any random signal, meeting the requirement
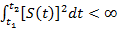 ,
,
could be represented by the orthogonal system of functions:
 ,
,
the coefficients in which are determined as following:
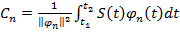 ,
,
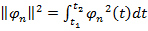 &mdash squared norm, or the energy of the basic function.
The task of spectral analysis is experimental or analytical determination of the coefficients
 .
.
The Fourier transform (FT) uses sine and cosine as orthogonal system of functions. The disadvantage of this approach lies in the fact that these functions have the same characteristics in the entire time interval. At the same time, most of the signals are nonstationary. This means that their frequency content is continuously changes, reflecting the dynamic physical processes taking place in the test object. Therefore, such signals local features are practically invisible in the spectrum obtained with the help of the FT.
The wavelet transform allows to research structure of nonstationary signal thoroughly. It is based on using a signals, called wavelets, as orthogonal system of functions. An example of wavelet, called "biorthogonal", is shown in Figure 2. General view of the wavelet functions:
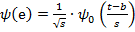 ,
,
where:
- s &mdash the scaling coefficient. If s>1 signal stretches and increases in amplitude, so frequency spectrum of the wavelet shifts toward increasing frequency, when s<1 &mdash toward decreasing frequency;
- b &mdash the shift coefficient, provides movement of a wavelet in time;
-
 &mdash the mother wavelet;
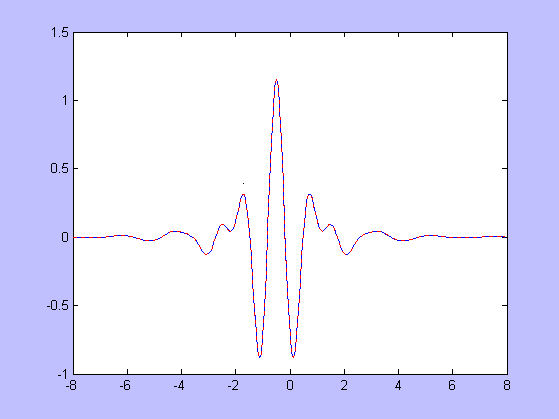
Figure 2. Biorthogonal wavelet
Wavelets have several properties, causing the value of this method in the analysis of nonstationary signals:
- &mdash zero value of the integral;
- &mdash time localization (in contrast to the sine function);
- &mdash time shift ability;
- &mdash scaling ability;
- &mdash limited frequency spectrum;
It should be noted that the spectral representation of wavelets is similar to the window specifying in the windowed Fourier transform.
With continuous wavelet transform basis functions is a continuous scale transformations (s) and transfers (b) of the mother wavelet. Then direct CWT is represented by the equation:
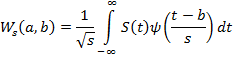 .
.
Getting a spectrogram with continuous wavelet transform is shown on the figure 3.
 .
.
Figure 3. Getting a spectrogram with continuous wavelet transform
Dimensions: 560 x 420
Size: 8,107 Kb
Frames: 18
palette: 256 colors
I also follows, that wavelet spectrum W_s (a,b) is a function of two arguments: a (time scale) and b &mdash time shift.
In practice, discrete wavelet transform is the most frequently used. It involves a discretization in time not only the signal but also the coefficients a and b. Since the continuous wavelet transform allows more detail research the structure of the signal (although it requires large computational cost), it is applied in the beginning of the work.
Spectrum of sound recordings was conducted in the Matlab environment, which contains a fairly complete package of functions for wavelets and a wide variety of mother wavelets. We use two entries &mdash one of them is recorded when the test reliably ended by an explosion, on the other there is only a blow of the movable platform on the investigated substance. The sounds are single-channel. The signals was analyzed using biorthogonal wavelet, which showed the most illustrative results. The spectrogram is a function of two variables and is represented by a projection on the plane, and the values of the coefficients reflect in color. These spectrograms are shown on Figure 4.
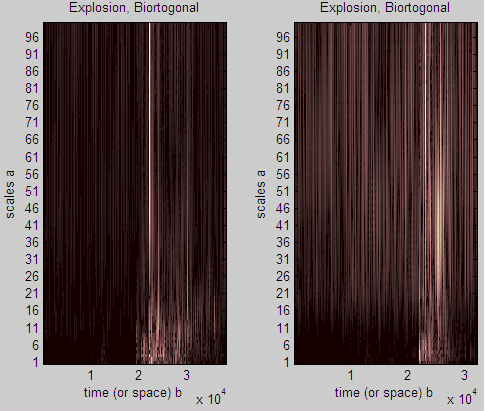
Figure 4. Researched sound signals spectrograms
In this figure, there are signs of a large number of interferences. This is due to the fact that the sound test was recorded using digital voice recorder, This sound will be recorded anew in the near future. Another factor that distorts perception of the outcome, is that on these graphs different scales of values of the coefficients are used.
Nevertheless, some details of signals in the above spectrograms are present. The bright vertical band characterizes the moment of impact on the mobile platform frame. On the right side of the figure, there is also a large number of similar parallel strips of the echo from the blow. At the bottom of the chart, which corresponds to higher frequencies, there is a growing power of the signal components. Assumed that this frequency region corresponds to the detonation.
Thus, the wavelet transform allows to identify local features of geological explosion sound. Consequently, it is applicable to the task.
Literature
- Wang Jiachun. Simulation of Seismic Waves / Wang Jiachun, CAI Laizhong // Insti-tute of Nuclear Energy Technology, Tsinghua University, Beijing, 100084, China. &mdash 2001.
- Трифон Ламброу. Применение вейвлет-преобразования к обработке медицинских сигналов и изображений / Трифон Ламброу, Альфред Линней, Роберт Спеллер // Компьютерра Онлайн. &mdash 1998.
- К. Ю. Силкин. Оценка возможности применения вейвлет-анализа к сейсмологическим данным / К. Ю. Силкин, А. И. Дубянский // Вестник. Периодический научный журнал. &mdash 2008.
- В.М. Ващенко. Аналіз першого вступу сейсмічного сигналу з метою оперативного оповіщення про землетруси / В.М. Ващенко, І. В. Толчонов, Ю. О. Гордієнко // Національна бібліотека України ім. В. І. Вернадського. &mdash 2008.
- А. С. Стукалова. Применение вейвлет-преобразования для интерпретации геофизических сигналов и определения скорости распространения акустических волн в среде / А. С. Стукалова // Рязанский Государственный Радиотехнический Университет. &mdash 2007.
- Л. И. Мещеряков. Информационное обеспечение АСУТП с помощью вейвлет-функций / Л. И. Мещеряков // Украина, Днепропетровск, Национальный горный университет. &mdash 2006.
- Добеши И. Десять лекций по вейвлетам / И. Добеш. &mdash Ижевск : Регулярная и хаотическая динамика, 2001. &mdash 464 с.
- Мала С. Вейвлеты в обработке сигналов / С. Мала. &mdash М. : Мир, 2005. &mdash 671 с.
- Яковлев А. Н. Введение в вейвлет-преобразования / Учеб. пособие. &mdash Новосибирск: Изд-во НГТУ, 2003. &mdash 104 с.
- Астафьева Н.М. Вейвлет-анализ: основы теории и примеры применения // Успехи физических наук. 1996. Т.166, № 11. С. 1146-1170.
- Перетокин С. А. Комплексный анализ пространственно-временных данных о природных явлениях / Перетокин С. А. // Международная конференция молодых ученых по математическому моделированию и информационным технологиям. &mdash 2002.
- Черный А. П. Вейвлет-анализ предаварийных режимов синхронных двигателей для настройки их защит / Черный А. П., Лашко Ю. В., Киба И. И., Остапенко Е. В., // Кременчугский государственный политехнический университет им. М. Остроградского. &mdash 2009.