


Ivan Ponomarev
Electrotechnical Faculty
Department of Electrical Systems
Speciality "Electrical systems and networks"
Estimation of electromagnetic compatibility by non-symmetry and non-sinusoidality voltage in electric networks with electric arc steel-melting furnaces
Scientific adviser: Ph. D., prof. Elena Dmitrieva
CONTENT
- Introduction
- 1 EAF as a source of electromagnetic disturbance
- 2 Non-sinusoidality estimation in electric network with EAF
- 2.1 Normalization of the voltage non-sinusoidality
- 2.2 Input data for non-sinusoidality estimation
- 2.3 Extraction of nonsinusoidal component
- 2.4 Assessment of RECON errors at the non-sinusoidality analysis
- 2.5 Analytical solution at the non-sinusoidality analysis
- 2.6 Review of methods of determining the sinusoid parameters
- 2.7 Interharmonics in the non-sinusoidality analysis
- 3 Non-symmetry estimation in electrical network with EAF
- Conclusions
- References
THE ABSTRACT ON A THEME OF MASTER'S WORK
INTRODUCTION
Metallurgy industry continuously developes. Electrical arc furnaces (EAF) are sources of electromagnetic disturbances: they produce the higher harmonics and interharmonics, voltage fluctuations and voltage deviations. Disturbance generation is observed in the fluxing period to a considerable. As a result of disturbance effect the operation efficiency of both EAF and electrical power system reduces. Therefore, these EMC indicators should be correct by estimated.
Currency of the theme:
1) the scientific currency is connected with studying of interharmonics which appears at the voltage fluctuations;
2) the practical currency is connected with development of methodology for the voltage non-symmetry and non-sinusoidality estimation when EAF work that would allow to give objective estimation of the disturbance level in the electrical network.
The purpose of the work:
1) estimation of non-symmetry and non-sinusoidality by the voltage and current realizations group, obtained with the aid of the recorder RECON;
2) estimation of the error of voltage non-sinusoidality analysis by the recorder RECON;
3) developing of program of EMC indicators calculated by the voltage and current EAF curves.
The idea of work. Digitized current and voltage curves were obtained by the recorder RECON are input data for the work.
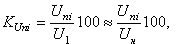
According to [1], non-sinusoidality is characterized be the following indicators:
– sine wave distortion factor;
– coefficient of the n-th harmonic component of voltage ,
which is estimated by 40 harmonics. Therefore, using the Fourier resolving we find the amplitude and phase spectra of a given curve.
With RECON we can also carry out a spectral analysis of the curves. However, we must ourselves carry out a spectral analysis and compare the results with RECON’s results.
The main tasks of research and development: by the given voltage and current curves, it is necessary:
– to estimate EMC using non-symmetry and non-sinusoidality;
– to estimatе the error analysis of voltage non-sinusoidality by the recorder RECON;
– to develop the program of EMC indicators calculation by the voltage and current EAF curves.
Methodology of research: EMC estimation using voltage non-symmetry and non-sinusoidality
Methods of research: methods of probability and statistical dynamics.
The scientific novelty of this work is connected with studying of interharmonics which appear at the voltage fluctuations.
Practical application: developed program allows to improve the input data in case of their lack.
Review of research and developments on the subject. Questions of EMC and particularly – the statistical simulation of random processes in electrical networks are engaged in DonNTU by E. G. Kourennyi, E. N Dmitrieva, N. N. Pogrebnyak.
The following scientasts greatly contributed to the quetions of power quality: G.Y. Vagin, S. R. Gliternik, A.A. Yermilov, I.V. Zhezhelenko, Y.S. Zhelezko, R.V. Mineev, M.J. Smelyansky, D. Arrilaga etc.
1 EAF AS A SOURCE OF ELECTROMAGNETIC DISTURBANCE
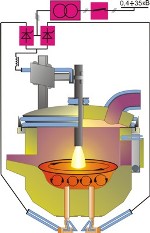
Electric arc furnaces (EAF) (fig. 1) are the sources of electromagnetic disturbance (EMD): such as the higher harmonics and interharmonics, voltage fluctuations and voltage deviations. To the greatest extent the EMD generation appears during the melting period. Melting period is accompanied with significant fluctuations in the EAF’s active and reactive powers in the range 0.1 ... 15 Hz [2, p. 29].
|
Figure 1 – EAF's scheme |
A wide range of the currents change in three phases of the EAF and as well as the imperfection of the short network cause a current and voltage non-symmetry [2, 3].
Current disturbances of EAF cause random voltage fluctuations and voltage deviations.
Studies show that the voltage deviation is defined by load power of EAF. Voltage deviation, which equal–5 ... –10%, on the EAF buses, influence on the change of EAF productivity and virtually no impact on other power-consuming equipment in the electricity system, if EAF connected to a separate busbars of the electricity system [2, p.30].
Voltage non-symmetry is set by the difference in the arcs currents of three phases and features of the short network. At voltage non-symmetry, the useful capacity of three-phase electrical network decreases, there are additional power losses in the elements of power system, heating of electrical machines increases, reliability and efficiency of production, transmission and consumption of electricity is reduced [4, 5].
Nonlinearity of volt-ampere characteristic of the EAF arc distorts the current waveform and generates the higher harmonics [6, 7].
Thus, EAF is the "generator" of almost all types of electromagnetic disturbances. Therefore, the accurate estimation of the EAF’s effect on power system is necessary.
2 NON-SINUSOIDALITY ESTIMATION IN ELECTRICAL NETWORK WITH EAF
2.1 Normalization of the voltage non-sinusoidality
Voltage non-sinusoidality in all standards is estimated by the sine wave distortion factor and coefficient of the n-th harmonic component of voltage, which for brevity will be called the coefficients distortion and the harmonics [8, p. 195].
Number of observations N must be nine or more for the averaging interval. The results of the i-th observation calculates as:
2.2 Input data for non-sinusoidality estimation
EAF's voltage and current curves, obtained by the recoder RECON are input data for the non-sinusoidality estimation.
RECON provides an opportunity to make a spectral analysis of the curves. But it is necessary to carry out the whole procedure of spectral analysis for estimating of the error of non-sinusoidality analysis with RECON.
Let's consider one period of the EAF voltage curve (Fig. 3).
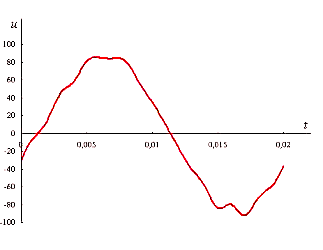
Figure 3 – One period of the distorted voltage curve of EAF
According to [1], non-sinusoidality is characterized by distortion coefficient you need to know the value of 40 harmonics for that. For this one need to find a spectrum of effective currents and voltages.
2.3 Extraction of non-sinusoidal component
As electricity is transmitted at a frequency f = 50 Hz, it is natural to present the process voltage value change u(t) as a sum of two components: sinusoidal with a frequency of 50 Hz and non-sinusoidal
uv(t) = u(t) − uf(t) (1)
which are termed a sine and a disturbance, respectively.
The case of a periodic disturbance with a period tf = 1/f = 0.02 s Is considered, is being superimposed on the sinusoid with the same period.
Parameters of the sinusoids are determined in many ways. Good result is given by the method of the least squares. Resolving into a Fourier series is used as well. We use the latter one in the work of questions.
The sampling frequency for the curve (fig. 3) is 2000 Hz. This means one period of the curve has 20 points. At this amount of points, RECON gives value of 9 harmonics. That is two points per one harmonica, which is insufficient for accurate assessment of non-sinusoidality. In our case, one harmonic will have five points. Hence, it is necessary to know at least 200 points for a period. For this we use an interpolation of a given function using spline.
Voltage is presented as the sum of the first (fundamental) harmonic u1F(t) and the sum of the canonical harmonics un∑(t) with the order n ≥ 2 [8]:
u(t) = u1F(t) + un∑(t). (2)
Substitute equation (2) into (1). We obtain the disturbance equation:
uν(t) = u1F(t) – uf(t) + un∑(t).
Assume that the non-sinusoidal component coincides with the sum of higher harmonics, i.е.uf(t) = u1F(t).Then the disturbance equation is as follows:
uν(t) = u(t) – u1F(t).
Fig. 4 shows graphs of disturbance, sine wave components and the Input function.
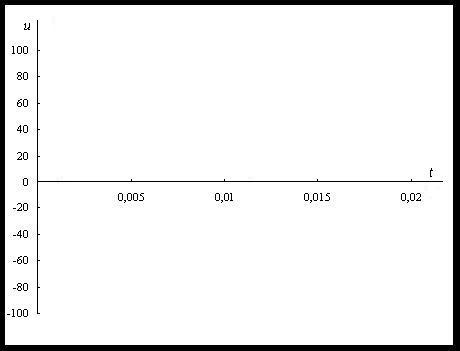
Figure 4 – Diagrams of the Input curve, sine wave component and disturbance
2.4 Assessment of RECON errors at the non-sinusoidality analysis
Fig. 5 shows depedence of the non-sinusoidality factor on the number of harmonics. The diagram is obtained with taking into account the fact that the one harmonic has five points.
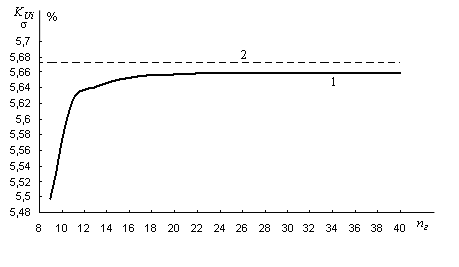
Figure 5 – Dependence KUi = f(nг) (1), standart (2)
According to RECON non-sinusoidality factor is KUi = 6.138 %.
By disturbance diagram (fig. 4) standard is σUν = 5,672 %.
It is seen from fig. 1, that non-sinusoidality factor is KUi = 5.659 % while taking into account 40 harmonics, it being less than the disturbance standard by 0.23 %.
Using of RECON for assess ment of the non-sinusoidality factor calculation with limited Input information leads to unexpected high requirements to power quality.
A cubic spline interpolation has good effectiveness at the little number of points per one period of sine functions.
2.5 Analytical solution at the non-sinusoidality analysis
Let's find the analytical solution of non-sinusoidal estimation.
The input equation is as follows:
u(t) = sin(ωt) + 0.03sin(3ωt) + 0.03sin(5ωt) + 0.02sin(7ωt)
From here disturbance is uν(t) = 0.03sin(3ωt) + 0.03sin(5ωt) + 0.02sin(7ωt)
non-sinusoidality factor is KUi = 4.69 %.
Disturbance standard is σUν = 4.69 %.
Fig. 6 shows the depedences of the non-sinusoidality factor from points number n.
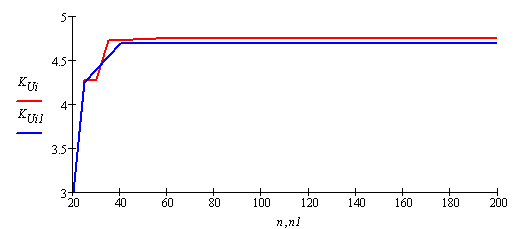
Figure 6 – Depedences KUi = f(n): red – at 20 points in one period; blue – at > 40 points.
By the results one may conclude:
– interpolation by 20 points per one period gives too high value of the non-sinusoidality factor;
– the optimal number of points per one period – 40;
– the optimal number of points per one harmonic – 5.
2.6 Review of methods of determining the sinusoid parameters
There are two engineering method of sine extraction: method of equivalent sine and method of the prior averaging (title – conditional) [8, c. 207].
The method of the equivalent sine based on the fact that the voltage standard σ for a cycle tf is little different from the effective value Uf of the required sinusoid. For example, in the case of periodic distortions, when the average value Uνc of disturbance is zero, the standard coincides with the effective value of voltage distortion U:
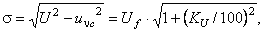
where KU – – coefficient of sine distortion, %. Relative error of the approximate equality
σ ≈ Uf
is
The following quantity is taken as the amplitude
Bf ≈ 2√σ
later the phase of the sinusoid is determined by the least squares method.
Pre-averaging method assumes that the voltage diagram is initially averaged on a large range of δ. In order to avoid the phase shift, averaging is performed from t–δ/2 to t+δ/2.
2.7 Interharmonics in the non-sinusoidality analysis
Interharmonics represent a sine change process in time of the instantaneous values of voltage u(t) which frequency differs from the frequency 50 Hz in smaller or larger sides [9]
Interharmonics appear due to fluctuations of the load currents, which cause the low–frequency modulation of the instantaneous voltage values.
In [1], rectangular window (Henning window) with a width of 0.32 s is used for the harmonics determination .
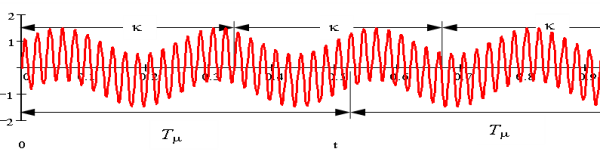
Figure 7 – The sum of harmonic signals with frequencies of 50 and 4 Hz, α = 0,5.
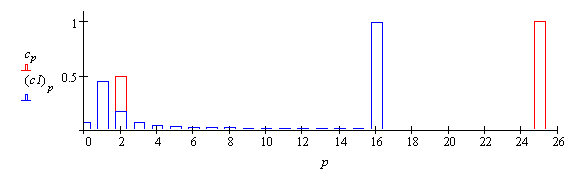
Figure 8 – Harmonic spectrum: fine (red) and defined on the interval 0<t<0,32 с (blue).
Error in the determination of the spectra lead to errors in assessment of the influence of voltage non-sinusoidality on the power–consuming equipment.

If using quasiharmonics with relative frequencies that excluding components with a frequency of 50 Hz (at q = 16), on each interval of 0.32 to obtain:
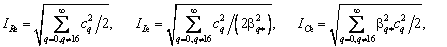
at constant voltage, when q = 0, the capacitive current is zero.
At ν = 4Hz and α = 0,5 (fig. 7) the exact value is: IRe = 0,3536; ILe = 4,4194 and ICe = 0,0283, whereas the first three intervals IRe = 0,353; 0,340; 0,365; ILe = ∞; ICe = 28,17; 44,42; 12,32. Difference in the results of estimating EMC is most clearly seen in the current through the inductor, which starts being infinite in case of the constant component (fig. 8), which does not exist.
Thus, the processing of waveform voltage by the standard procedure can not assess reliably the voltage non-sinusoidality impact on consumers. It is therefore necessary to replace [1] EMC performance of "harmonics" by non-sinusoidality doses [10].
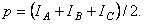
3 NON-SYMMETRY ESTIMATION IN ELECTRICAL NETWORK WITH EAF
Three-phase current non-symmetry is characterized by the coefficient of non-symmetry, which is defined as the ratio of the module of the negative sequence to the module of the positive sequence [11, p. 137]:
α = I2/I1
In the analysis of non-symmetric modes it is expedient to calculate the non-symmetry coefficient α directly through the modules of (rms) currents of the phases IA, IB and IC.
The formula to determine the non-symmetry coefficient α through the actual values of currents has the form:
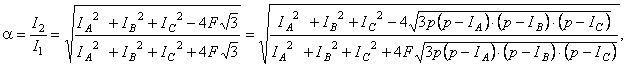
where 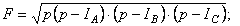
CONCLUSIONS
EAF is a source of many electromagnetic disturbance. Therefore, we need the accurate assessment of the EAF impact on the power supply system.
For non-sinusoidality and non-symmetry estimation, the current and voltage curves obtained with the aid of recoder RECON are the input data.
In this work we estimate the RECON’s error at non-sinusoidality estimation. For a small number of points for one sine cycle we must use cubic spline interpolation. RECON provides unexpected high requirements of power quality.
In order to have an accurate resolution of a function into Fourier series, it is necessary to have at least five points per one harmonic. It means 200 points per one period of sinusoid for 40 harmonics.
According to [1], interharmonics are ignored at non-sinusoidality estimation. In [1], a rectangular window (Henning window) with a width of 0.32 is used for harmonic determination, which gives a big error, if the period is different from the width of the window.
On the moment of writing this abstract the master's work was not completed. Its final variant can be obtained from the author or the scientific adviser after December 2011.
REFERENCES
- ГОСТ 13109-97. Межгосударственный стандарт. Электрическая энергия. Совместимость технических средств электромагнитная. Нормы качества электрической энергии в системах электроснабжения общего назначения [Электронный ресурс]. – Введ. с 01.01.1999.– Режим доступа: http://www.matic.ru/index.php?pages=123
- Д. Аррилага Гармоники в электрических системах / Д.Аррилага, Д. Брэдли, П. Боджер. – М.: Энергоатомиздат, 1990. – 215 с.
- И.В. Жежеленко Показатели качества электроэнергии и их контроль на промышленных предприятиях//2-е изд., перераб. И доп.,– М.: Энергоатомиздат, 1986 – 186 с.
- И. В. Жежеленко Качество электроэнергии на промышленных предприятиях / И. В. Жежеленко, М. Л. Рабинович, В. М. Божко. Киев: Техника, 1981 – 160 с.
- И.В. Жежеленко Высшие гармоники в системах электроснабжения промпредприятий /И.В. Жежеленко. – М.: Энергоатомиздат, 2000.
- Ю.С. Железко Компенсация реактивной мощности и повышение качества электроэнергии / Ю.С. Железко. М.: Энергоатомиздат, 1985.
- Н.В. Окороков. Дуговые сталеплавильные печи – М.: Металлургия, 1971. – 344 с.
- В.Г. Кузнецов Электромагнитная совместимость. Несимметрия и несинусоидальность напряжения / В.Г. Кузнецов, Э.Г. Куренный, А.П. Лютый. – Донецк: Норд-пресс, 2005. – 250 с.
- Л.А. Бессонов Теоретические основы электротехники / Л.А. Бессонов. – М.: Высшая школа, 1964.
- Э.Г. Куренный Оценка несинусоидальности напряжения при анализе качества электроэнергии / Э.Г. Куренный, А.П. Лютый // Электричество, 2005, № 8.
- Р.В. Минеев Повышение эффективности электроснабжения электропечей Текст. / Р.В. Минеев, А.П. Михеев, Ю.Л. Рыжнев. – М.: Энергоатомиздат, 1986. – 207 с.