| Resume |
1.GENERAL DESCRIPTION OF THE RESEARCH
1.2 Relationship with academic programs, plans
1.3 The goals and tasks of the research
1.6 Scientific novelty of the obtained results
1.8 Testing results of the work
3. BRIEF DESCRIPTION OF THE GEOLOGICAL STRUCTURE OF THE OBJECT OF RESEARCH
3.1 Stratigraphy and lithology
3.3 Geologycal operating conditions
4.1 Azimuth method of structural-geodynamic mapping (SGDK-A)
4.2 Methodology of athmogeochemical research
Nowdays, connected with intensive mining operations in Donbass the problem of deformation of residential buildings and industrial accomodations is actual. It is found out as well, that the most dangerous areas are confined to active infraction. Such structures in the upper part of the top sediments reveal themselves as some anomalies of geophysical and athmogeochemical fields, which form the geodynamic zones.
This research is actual because of the fact that active geodynamic structures in the settlements lead to deformation of residential buildings and industrial structures and the accumulation in the soils of dangerous gases - methane and radon.
1.2 Relationship with academic programs, plans
The research is connected with the scientific-research work of the department of PI Chair and EG N8-07 “Survey of geological features and structure of zones of ecological risk of Donetsk region and development of prognosis methods ”, with the theme of “The Preservation and development of the environment ” basic scientific spheres and the most important problems of fundamental research in the sphere of natural, technical and humanitarian sciences in 2009-2013.
1.3 The goals and tasks of the research
The purpose of research is a reveal of ecologically dangerous geological structures within settlements Donetsk and Yasinovataya, establishment of the specific features of their impact on the electromagnetic field and the gas composition of the soil, the creation of prognosition methods such dangerous phenomena on the basis of the geophysical and agrogeochemical survey.
Research tasks:
1. Experimental field geophysical investigations by the azimuthal electromagnetic survey over the known geological structures, which result in deformations of buildings and constructions;
2. Experimental field studies of gas survey of soils over the known geological structures, which form the environmentally dangerous gas anomalies in the soils;
3. The improvement of methods of complex processing and reliable interpretation of field geophysical and athmogeochemical data due to computer programs;
4. Development of recommendations on forecasting of dangerous geodynamic phenomena on the basis of the geophysical and athmogeochemical survey.
The objects of the research are dangerous geodynamic structures on the territory of Donetsk and Yasinovataya.
The subjects of research are anomalies of electromagnetic field and the gas compositions of soils, which are connected with the environmentally dangerous phenomena.
1.6 Scientific novelty of the obtained results
There was set a complex of athmogeochemical and geophysical researches on the territory of the town Yasinovataya and village Yakovlevka. Determined activity Pantheleymonоv’s thrust in the modern era and the permeability of it and additional structures for environmentally dangerous gases.
Carried out researches have value to the design of buildings and industrial constructions, communications, it will allow us to make recommendations for improvement of ecological situation; the implementation in practice of the recommendations will contribute to improve the living conditions of the population and reduction of the technogenic load on the environment.
1.8 Testing results of the work
Results of researches were reported at the conference “Geography, geo-ecology, biology, geology: the experience of scientific research in the context of international cooperation ” 2010, The DNU named after Oles Gonchar, Dnepropetrovsk; at the conference “Geography, geo-ecology, biology, geology: the experience of scientific research in the context of international cooperation”, 2011, The DNU named after Oles Gonchar, Dnepropetrovsk; at the conference “Modern tendencies of the scientific paradigm of geographical education of Ukraine ”, 2010, ДИСО, Donetsk, at the conference “Protection of the environment and rational use of natural resources “, 2010, Donntu, Donetsk; participation in the university competition of student's scientific works on section “the Geological sciences “, 2009, Donntu, Donetsk. On the topic of work has four publications.
In the 70-s years of the first issues of modern geodynamics at the regional and local level started R`aboshtan Y.S. In 1977 the azimuthal structural and geodynamic mapping method (SGDK-A) was developed by , scientists Tachtomirov E.P. and R`aboshtan Y.S. Method SGDK-A refers to the methods electromagnetic field study, it is based on the registration and analysis of azimuthal anisotropy of electric conductivity of different environments. For realization of the method of structural and geodynamic mapping of those same scientists was developed and patented the device EFA [1].
On the areas of geophysical research method SGDК-A and athmogeochemical studies have been carried out in insufficient volume. On the territory of the town of Yasinovataya these studies were not carried out earlier and performed for the first time.
The study of the environmental impacts of fault zones on the environment for example Mushcetovsky`s thrust was devoted to the research Nikolaeva I. U., Shurhovetskogo S. A., Vlasova P. A. This work allowed refine the position Mushketovsky thrust on a site of research, to install especially its manifestations in the gas and the electromagnetic field of soil sediments and determine permeable areas .
The study of zones of ecological risk and the methods of their detection on the example of the city Donetsk did Alekhin V. I., Sanina O. N., Molodan E. V. [2]. By the authors of studies have confirmed the effectiveness of the method SGDK-A at detection of active geodynamic zones in the mountain range, associated with tectonic discontinuous violation of various grades.
Detection and tracking of geodynamic zones and associated tectonic disturbances in the Donbass region did Selyukov E. I., Stigneeva L. T. [3]. Researchers presented the results of the work method the structural and geodynamic mapping at different objects of the projected constructioning.
In the direction of geodynamics on the livelihoods of the human worked researchers such as Trofimov V. T., Ziling D. G., Governor B. I., Sobolev E. G., Rusanov A. N., Panov B.S., Savchenko A. V., Alekhin V. I. [4, 5]. Studies proving the need of the geodynamic mapping at the stage of designing, construction and selection of sites under various structures.
3.1 Stratigraphy and lithology
Geological deposits in the area of research presented rocks suites C25, С26, C27, which are meso-cenozoic loose sediments.
On the balance sheet of mine “October mine”, where the works were carried out, there are 11 coal layers: 8 suites С26, 2 – C27 and 1 C25. Rocks containing coal seam m3, presented alveolitis-argillites with subordinate layers of sandstone.
Coal-deposits of the pit mine to them. A.F. Zas`ad`ko and plot are the scrolls C27, С26 and C25. On the balance sheet of mine there are coal layers m81, m51, m41, m40, m3, m2, l81, l8, l71, l7, l4, l5, l21, l1 (l1в - l1н), k8, k7, k61, k51, k5, are currently being developed layers m3 (ranging from 1.00 to 2.15 m), l4 (0,85-2,00m), l1 (0,80-1.95 m) and k8 (0,75-1,23 m) at the depths of 1220-1420 m. The coal seams are in bold and coke marks E and K. Layers of dangerous dust, sudden emissions of coal and gas m3 and l1 – are prone to spontaneous combustion.
The Field of the "October mine" is located in the southern part of the Kalmius of the Toretska basin. The area of the field is closed between Coke by pushing in the west and flexurous fold in the east, which represents a lowered wing Vetovskaya flexure and thrusts Vetka no. 2, Vetka no.3 and the thrust "B" has an amplitude about 12 m.
Coke oven thrust has a height of 40-550 m, which decreases with depth of up to 35 m. The Amplitude of Vetka thrust no.2, which increases with depth ranges from 20 to 50 m, Vetka no.3 – from 1,6-5,0 up to 60-100 m. The Thrust "B" has a height of 12 m.
The main part of the mine fiald is relatively calm, with flet-lying rocks from 8 to 15. In addition to substantial Vetkovskaya flexure, more than minor flexurous excesses are found: North and Central flexures, which have local development, and join in the east in Vetkovskaya flexure.
The Zasad`ko mine is located in the southern part of the Kalmius-Торецкой hollow on the high wing Ветковской флексуры. Coal deposits are gently sloping drop in the north-east, with angles 7-25 degrees.
In the structural-tectonic for mining field, along with the aforementioned plot located in the southern part of the Kalmius-Тhoreckaya basin, occupying the area limited on the west Vetkovskaya flexure, which is complicated by considerable Vetkovsky (amplitude H — 15-60 m, aoi 35-80) and Panteleymonovsky faulting (amplitude H — 10-100 m, aoi 60-75) and less steep Vetkovsky by pushing the № 4 (amplitude H — 10 - 35 m, angle of 40 degrees). Thrusts are submeridional, with the fall of opposing to the north-west angle 20-45 degrees
The eastern part of the area of the kalmius mine is limited by Grygor`evsky overthrust, with an amplitude of N - 37-55 m, angles of incidence in the north-west in 27-34 degrees. A number of minor thrusts the submeridional have the drop on the north-east at an angle of 10 to 50 degrees.
<3.3 Geologycal operating conditions
Roof rocks of coal beds are medium resistance (38%), about 23% of the existing lavas have mistaken the roof, 17% of the lav – soil, which puchatsya.
Geothermal site conditions are impermanent. Higher temperatures are confined to cross-fold. The temperature of the rock on the horizon 1000 m varies from 30. 4 to 52.6 degrees. The area is characterized by the highest consentration of methan mines. Mine "Oktyabrsky rudnik" is overnormed with gas content workings 18-42 m3/ t of s.s. and with a relative consentration of methan mine from 48-65 to 74-85 m3/ t s.s. according to the categorical measurements.
Zas`ad`ko Mine t is overnormed as methane dangerous on sudden emissions of coal, rock and gas, dangerous on the explosion of coal dust. The gas regime of mine complex, characterized by a significant.
4.1 Azimuth method of structural-geodynamic mapping (SGDK-A)
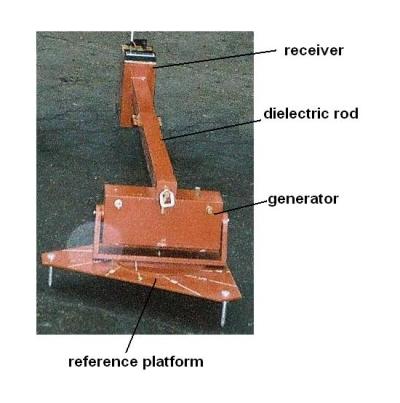
To conduct the research was chosen the method of structural and geodynamic mapping azimuth way. Azimuth survey (SGDK-A) is carried out with the help of device EFA - electronic lock of anisotropy. EFA is horizontal microbasical installation with a hard fixing of the magnetic dipoles, the device is designed to work in the mountain environment. The setlement belongs to the category of indicator measurement tools.
The EFA allows you to identify quickly geodynamic zones to change the anisotropy of the electrical conductivity in the surface sediment up to a depth of 2.5-3 m. To carry out observations at the picket need an open playground radius of about 1.5 meters. Error during the measurements give objects that have their own strong electromagnetic field (for example, power transmission LINES). Man-made coverage (asphalt, concrete), as well as natural (ice, snow), does not interfere the work, if their capacity does not exceed 2 m [3].
The Installation EFA consists of a generator and receiver mounted at the ends of the hard dielectric bar. In the area of the generator the end of the bar pivotally connected to the reference platform. Support platform provides a rigid stabilization of the installation on the field picket and the possibility of rotation beam in a horizontal plane, contains a magnetic compass, designed for the correct installation of the device on the field picket [6]. General view of the device is shown in fig. 4.1.
The main goal of the field of the research consists in the identification and registration of the azimuthal heterogeneity of the electrical properties of rocks surface of the horizon on geophysical pickets. Survey with a method (SGDK-A) was carried out according to the profiles, which have been set based on the analysis of geological structure of the site.
At each point (picket) of the profile setting EFA receiver was guided on a compass to the north. Then in this position was electrical conductivity was measured, and the board moved in the horizontal plane clockwise to remove the measurements in other directions. The measurements were carried out with the angular step in 30 degrees. Each fixed the status of the receiver is assigned to the serial number (code) from 0 to 12. The initial position was the number 0. The last measure taken in position 12. The last measure dubbed the measurement in the initial position and served as control. In case of difference of the first and the last measuring more than 4 units, measurments at the point of observation were repeated. This method provides high quality observations.
When measured, in each quadrant was chosen a direction with a maximum conductivity. In the case of two or more identical maximum values in one quadrant measurements were also occured. The measurement data were recorded in a special field magazine.
The measurements reflect the electrical conductivity of the soil in different directions. Their analysis allows you to set the direction of maximum conductivity within each of the four quadrants (sectors) of the terms on each field picket of the shooting.
For revealing abnormal anisotropy of the electrical conductivity of the soil three indicators were used: K1 — degree of stability profiling maximum conductivity profile; K2 — the degree of difference between the orientations maximum conductivity on the picket from the global background; K3 — degree of difference between the orientations maximum conductivity on the picket against the background of the shooting.
Anomalies in K1 no, if at all pickets we have one and the same direction maximum conductivity in each of the 4 sectors. The maximum intensity of anomalies on the K1 is determined, when in all sectors on this picket maximum conductivity change direction. The scale of the anomalous for this indicator is the following:
the changes only in one sector — 3 conventional units
the changes at once in two sectors — 9 conventional units
the changes at once in three sectors — 27 conventional units
changes simultaneously in four sectors — 81 conventional unit
As there is a natural heterogeneity of the physical properties of the soil and the random measurement errors, to reduce the influence of the assessment of the anomalous profile was carried out procedure filter field data window in five, seven and eleven points.
The anomalous characters in terms of K2 was estimated according to the degree of difference of maximum conductivity on this picket from the global background. The global background is characterized by the maximum conductivity in the areas of the north- east - south - west. Proceeding from this, for sector I background will be of 0 and 3 (in the code), for the sector II — 3 and 6, for the sector III — 6 and 9, For the sector IV — 9 and 12 (0).
The scale of the anomalous for the record K2 is the following:
differences from the background only in one sector — 4 conventional units
differences from the background at the same time in two sectors — 16 conventional units
differences from the background at the same time in three sectors — 64 conventional units
differences from the background simultaneously in four sectors — 256 conventional units
The anomalous character in terms of K3 was estimated according to the degree of difference of maximum conductivity on this picket against the background of the site. Character of local background conductivity of soils was determined on the basis of the statistical calculations performed by the sum of all points of observations. The results of this calculation are presented in the form of tables and rose-diagrams of maximum conductivity.
The scale of the anomalous for the K3 is similar to scale K2:
differences from the background only in one sector — 4 conventional units
differences from the background at the same time in two sectors — 16 conventional units
differences from the background at the same time in three sectors — 64 conventional units
differences from the background simultaneously in four sectors — 256 conventional units
Procedure of data processing and calculation of indicators was carried out with the use of special tables of data processing, an example of such a table is shown below (table 4.1).
Table 4.1 — Detail of the table data SGDK-A
| SECTOR | PICKET | DATA | ||||||||||
| 0 | 1 | 2 | 3 | 4 | 5 | 6 | 7 | 8 | 9 | 10 | ||
| I | 2 | 1/3 | 2 | 0 | 2 | 2 | 2 | 1 | 1 | 0 | input | |
| 2 | 2 | 2 | 2 | 2 | 2 | 0/2 | 0 | 0 | 0 | filtered data | ||
| II | 3/5 | 5 | 6 | 6 | 5 | 5 | 5 | 6 | 6 | 6 | input | |
| 5 | 5 | 5 | 5 | 5/6 | 5 | 5/6 | 5 | 6 | 6 | filtered data | ||
| III | 8 | 6 | 6 | 7 | 9 | 6 | 6 | 7 | 6 | 8 | input | |
| 6 | 6 | 6 | 6 | 6 | 6 | 6 | 6/8 | 8 | 8 | filtered data | ||
| IV | 9 | 12 | 11 | 11 | 9 | 9 | 12 | 12 | 12 | 11 | input | |
| 9 | 9 | 9/12 | 12 | 12 | 11/12 | 11 | 11 | 11 | 11 | filtered data | ||
| К1 | 1 | 1 | 3 | 3 | 1 | 3 | 81 | 27 | 3 | 1 | К2 | 16 | 16 | 16 | 16 | 4 | 16 | 4 | 4 | 64 | 64 | К3 | 16 | 16 | 16 | 64 | 16 | 64 | 4 | 4 | 64 | 64 |
With the help of computer programs on the calculated indicators (SGDK-A) graphs, on which stood areas of anomalous indices, which indicates the presence of fault within the data pickets [6, 7].
4.2 Methodology of athmogeochemical research
For the measurement of carbon dioxide and methane it is used a mine interferometer SHI-10 with a limit of measurement of methane and carbon dioxide from 0 to 6 % by volume. The device has an electric circuit with a power supply from 1 element type 343; optical system, through the eyepiece of which you can observe the interference picture; a system to absorb moisture from the soil air and carbon dioxide in determining the concentration of methane.
Before taking mine interferometer you want to check and prepare to work. Preparation of SHI-10 to the work includes the following operations: the switch on the device must be set to position “A”; tap on the panel of the device set to “CO2“; with the help of vacuum pears pump of atmospheric air; with the help of switch zero, located on the instrument, while pressing the power button power system to install the most dark line of the interference pattern at risk with a zero value.
The interference picture and the concentration of the gases at the same time there is in the eye of the optical system, which is located on the top panel of the device. Measurement of gases produced at the profiles of shooting, which were set on the ground after studying the geological situtsii. The distance between the points of sampling in the profile depends on scale research and varied from 5 to 20 m.
Depth of sampling soil air amounted to 0,8 m. Selection of the soil air is carried out from a pre-drilled hole through the cone of the probe inserted in the bore-hole bored, and vacuum hose. For the exclusion of the measuring instrument of water and dust between the sampler and measuring device installed a special filter.
The first measure is the concentration of gases — carbon dioxide and methane, in volumetric percent. Another measure of the concentration of methane in the same units. The concentration of carbon dioxide is determined by the difference of the first and second measurements [8].
Survey by method (SGDK-A) was carried out on the profiles of YAS-1 in Yasinovataya and YAK-1 to p. Yakovlevka Donetsk region. To assess the permeability of the structures and enhance the credibility of the geophysical survey in parallel with the geophysical investigations were carried out and athmogeochemical survey.
Profile YAS-1 in the town of Yasinovataya passed by (SGDK-A) 225 pickets. The profile from the north-east corner of the city cemetery g. Yasinovataya to the south. Profile crosses the street Poltava, st. Red October, st. Ordzhonikidze and the street Scripnika. The measurements were carried out with the help of installation of EFA, step up was 20 m. The profile were to be tied to the location using the GPS device.
In the process of shooting operators changed one by one, but not earlier than after 40 pickets with a view to ensure the accuracy of the measurements.
To improve the reliability of data processing and calculation of indicators were performed with the use of computer programs and special treatment tables two independent artists. Then the results of treatment were compared.
In the process of processing of the field data of two operators were built rose-diagrams of the local background (fig. 5.1).
As can be seen from the figures rose-diagrams a little different from each other, but in both cases remain the prevailing wind direction stretch structures quadrant (I — 0,3; II — 3,6; III — 6,9; IV - 9).
To eliminate random noise values were smoothed in the windows of various sizes (5, 7, 11 pickets).
As a result of studies for the particular landscape and tectonic conditions it has been established that the most optimal window at a step of 20 m is the window in 11 pickets. It is a window anti-aliasing provides the most explicit manifestation major thrusts in the graphs indicators on the profile, because the window in the 5 and 7 of the pickets identified a number of anomalous peaks, on the background of which were not observed major search faults.
In three of the (SGDK-A) (K1, K2, K3) was built combined schedule, reflecting the abnormal areas (figure 5.2).

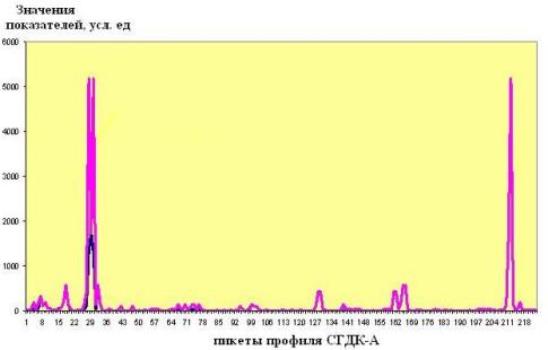
The results of processing the data visualized multiplicative indicators СГДК-A and the anomalous sites — geodynamic zones (Fig). It has been established that anomalies were found in the set of indicators in the area of pickets 7-32, 129-128, 162-166.
Part of the anomalies associated with the zone of influence of major Panteleymonovsky thrust or with other small discontinuous violations, which finds confirmation in the geological data (Fig. 5.3). Geodynamic zone in the area of pickets 211-216 pickets is characterized by unusual activity. On the geological map there are no major faults in the area of this zone (see. Fig. 5.4). In view of the fact that the geological exploration small tears are not installed, we assume here active tectonic break a small amplitude.
It is known that small developing tears are most active in the geodynamic plan. These structures can become a great danger for the integrity of the buildings. Deformation along such structures were observed in Donetsk [6, 7].

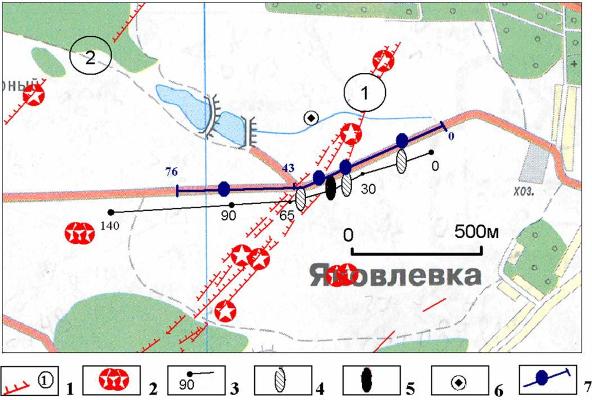
1 — thrusts; 2 — zone Panteleymonovsky thrust; 3 — geodynamic zones; 4 — profile (SGDK-A); 5 — rooms: a — GPS points, b — pickets profile; 6 — profile gas capture; 7 — a drinking water reservoir for the 3-th micro district.
For detection any gas anomalies in the area of reservoir of drinking water for 3-th micro district (the beginning of the profile YAS-1) was carried out gas survey. This method (SGDK-A) identified here an active anomalous zone.
Studies were carried out in the appropriative form on the perimeter of the tank (see fig. 5.4). Profile passed with the step of 10 m, the total length of the profile is about 0,5 km. Depth of sampling soil air amounted to 0.6 m.
Statistical processing of measurement allowed to set the background levels of the gases CO2 + CH4 and to identify anomalies. Background gas field on the surveyed period amounted to 0.3 % by volume. Installed anomalies from 0.5 to 1 % by volume. Anomalies of gases in volume 1 % were observed in the area of pickets 43-44 this profile. Anomalies in 0.7 % by volume are observed in the area of 19 and 28 of pickets, minor anomalies in 0,5 % by volume recorded on individual pickets.
The second gas profile was passed along geophysical profile also with step observation of 10m. The profile from the north-east corner of the city cemetery g. Yasinovataya to the south. Length of the profile was 400m. Depth of sampling soil air was also 0,6 m. Background gas fields on this profile at the time of the surveying was 0.1 volumetric %. The anomalies of the gases CO2 + CH4 from 0.3 to 1.3 % by volume. Methane anomalies in 1.3 % by volume, which is more than 10 times higher than the background value, observed on 10 and 31 pickets. Anomaly in volume 1 % recorded in the 21 picket, methane anomalies in 0.7 % by volume are located on 20 and 37 pickets profile. As a whole on area studies received 86 measurement of gases in the soil air.
Comparing the results from the geophysical and athmogeochemical studies conducted in the town of Yasinovataya, we can make a conclusion that the method (SGDK-A) geophysical anomaly in the area of pickets 7-32 (see figure 5.3), confirmed by the gas shot. This anomaly fixes breaking violation with high gas flow.
In p. Yakovlevka we made the same study. We surveyed the azimuthal electromagnetic method of structural and geodynamic mapping (SGDK-A) on the profile of the YAK-1 and gas survey for several profiles.
Athmogeochemical studies were carried out on one of the extended profile and two short profiles (fig. 5.5). Depth of sampling of soil
1 — zone thrusts on the reservoir m3; 2 — areas of dangerous gas dynamic phenomena in mountain developments of mine Zasyadko; 3 — profile gas capture and non pickets; 4 — anomalies gases in 3-5 times greater than the background; 5 — air gases in the 9-10 times greater than the background; 6 — plot well; the profile of the geophysical survey method (SGDK-A)with the revealed anomalies.
Аir amounted to 0,8 m. Short profiles have been set near gasdreined wells with the purpose of definition of parameters of gas fields of soil sediments over the well known accumulation of methane gas. Step observations along these profiles amounted to 1m. Extended profile was set on the site microamplitudous rupture dislocations, identified by mining works at working off of coal seam m3. In general, these modules formed the north-eastern strike. It is to this area were timed numerous gas dynamic phenomena in mines. The profile was passed across a stretch of dislocations with step observation of 10m. Length of the profile is more than 1km.
As a result of research we received 170 measurement of carbon dioxide in the soil air. Statistical processing of measurement allowed to set the value of background concentrations of CO2 and to identify anomalies of this gas. Background gas fields of CO2 on the surveyed period was 0.1 volumetric %. The anomalies of CO2 from 0.25 to 6 % by volume. In one of abnormal point the concentration of CO2 and methane exceeded limits measurement instrument (more than 6% by volume). This point is located directly by the gasdreined well and, probably, a gas leakage due to technical reasons. At a distance up to 10 m from it in the soil air were recorded concentration of carbon dioxide at 0.75 %, that in 7.5 times higher than the background value.
On long profile identified three areas of anomalous contents of carbon dioxide in the eastern part of the profile, in the central and western parts. Central abnormal area formed three localized anomalies of CO2. Here are the greatest by the profile CO2 concentration , exceeding the background by 9 times. This abnormal area is superimposed on the eastern edge of the area мелкоамплитудной disturbance seams m3 and l1 S a stretch. Obviously, this area of dislocations crosses the whole of the coal stratum up to the day surface and has a steep fall to the west. As noted above, exploration and mining works it has been established that the structure of controls of methane in coal seams [9, 10].
The second largest abnormal area is eastern. Here are three associated abnormal points with maximum concentration of CO2 in the 0,5 % (5-fold excess of the background). In the western part of the profile was discovered by one point with low contrasting anomaly of CO2.
On this site was executed survey by azimuthal electromagnetic method of structural and geodynamic mapping (SGDK-A). Profile of the YAK-1 is passed on 76 pickets with the step of 10 m along the profile gas survey.
The results of processing the data (SGDK-A) the timetable indicators and identified anomalous sites (see fig. 5.5). The results of the gas and geophysical surveys have confirmed the existence of active dislocations on the site, which is permeable for carbon dioxide and methane.
1. Панов Б. С., Рябоштан Ю. С., Алехин В. И. и др. О новом методе структурно-гединамических исследований //Советская геология, — 1984.-№ 1. — с.66-75.
2. Санина О. Н., Молодан Е. В., Алехин В.И. Охрана окружающей среды и рациональное использование природных ресурсов// Сб. ст. VI Международной научной конференции аспирантов и студентов. Т.2 — Донецк: ДонНТУ, 2007. — с.102-103.
3. Селюков Е. И., Стигнеева Л. Т Краткие очерки практической микрогеодинамики, — СПб.: Питер, 2010. — с. 56.
4. Санина О. Н., Алехин В. И. Зоны экологического риска и методы их обнаружения на примере города Донецка //Охорона навколишнього середовища та раціональне використання природних ресурсів. Зб. доп. VI міжнар. наук. конф. аспірантів і студентів, — 2007. — Т. 2. — с. 102-103.
5. Алехин В. И., Санина О. Н., Сахарова Н.А., Ковалева О.А. Зоны геолого-экологического риска тектонической природы и безопасность жизнедеятельности //Научные труды ДонНТУ. Серия горно-геологическая, — 2007. — Вип. 6(125). — с. 149-152.
6. Алехин В. И., Аноприенко А. Я., Анциферов А. В., Купенко В. И., Панов Б. С., Приходько С. Ю. Геодинамическое картирование: методы и апаратура, — Донецк: ДонНТУ, Технопарк ДонГТУ Унитех, 2007. — с. 144.
7. Панов Б. С., Рябоштан Ю. С., Алехин В.И и др. Hовые методы изучения современной геодинамики активизированных областей //Вестн. Киевского ун-та. Прикладная геохимия и петрофизика, — Киев: 1983. — Выпуск 10. — с. 91-99.
8. Алехин В. И., Проскурня Ю. А. Методические указания к выполнению лабораторных работ по дисциплине «Эколого-геохимическая съемка» для студентов направления 0708 Экология. — Донецк, ДонНТУ, 2008р. — с. 27
9. Гавриш В. К., Добрянский Л. А., Алехин В.И. и др. Особенности атмогеохимического поля Опошнянского газоконденсатного месторождения в Днепровско-Донецкой впадине // Докл. АH УССР, — 1989. — Сер.Б, № 1. — с. 7-10.
10. Гавриш В. К., Рябоштан Ю. С., Алехин В.И. и др. Атмогеохимическое прогнозирование неотектонически активных зон в Донбассе, Днепровско-Донецкой впадине и других регионах // Препринт, — Киев: АН УССР, Ин-т геол. наук, 1990. — с. 43.
| Resume |