
Faculty: Faculty of Computer Science and Technology
Department: Information Control Systems
Specialty: Information Management Systems and Technologies
Modeling and visualization of wireless sensor networks
The scientific adviser: Ph.D. Telyatnikov Alexander
- Relevance WSN
- Task setting
- Technology WSN
- Topology
- Emulators
- Emulator TOSSIM
- Method of visualization of the graph by means of physical analogies.
- The specification of the unit of visualization
- Conclusion
- Literature
Wireless sensor networks, unlike conventional computers (wired and wireless) networks have many advantages:
- the complete absence of any kind of cables - electric, communication, etc.;
- the possibility of compact accommodation, or even integration Motov objects in the environment;
- reliability of individual elements and, more importantly, the whole system, and in some cases, the network can operate in good condition only 10-20% of sensors (Motov);
- Lack of appropriate staffing for the installation and maintenance.
Sensor networks can be used in many application areas. Wireless sensor networks - a new promising technology, and all its associated projects are mainly in the development stage. We indicate the main areas of application of this technology:
- defense and security
- control environment;
- monitoring of industrial equipment;
- security systems;
- Monitoring of agricultural land
- energy management;
- control of ventilation, air conditioning and lighting;
- fire alarm system;
- inventory control;
- tracking of cargo transportation;
- monitoring the physiological state of man;
- monitoring staff.
A real example of using WSN - Wireless System monitoring of building structures designed by a Russian company methlogic in 2010. The system provides gathering, recording and display readings from a variety of sensors installed at various structural elements to control their stress-strain state and structural integrity.
Wireless sensor networks (WSN) - the perspective technology, has a several advantages in front of usual computer networks. In particular this total absence of any cables, possibility of compact layout and integration of squanderers into objects of environment and reliability of all system as a whole. WSN can be used for the decision of a wide spectrum of tasks from control of environment before usage in defense and safety systems. In order to save money for revision and correction has already implemented wireless sensor networks they are working on using the emulator, to identify problems, bottlenecks. The operation task is creation of the program which on the basis of emulator TOSSIM simulates a wireless sensor network, the graph of a network and its operation in real time with observance of norms and criteria displayed. Block diagram of the visualizer is shown in Fig.1
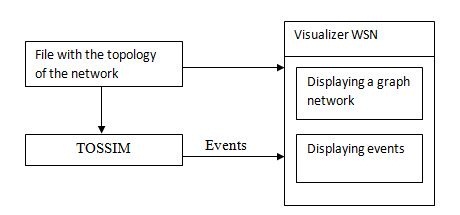
Figure 1 - Block diagram visualizer
Wireless sensor networks consist of miniature computing-communication devices - motes, or sensor controls. The mote represents a board in the size normally no more than one cubic inch. On a board the processor, storage - a flash and operative are allocated, digital/analog and analog-digital converters, the radio-frequency transceiver, the power supply and sensors which are connected through numeral and analog connectors (more often others are used sensors of temperature, pressure, damps, illuminance, vibration). A set of sensors used depends on the functions performed by wireless sensor networks. Motes are used only for collection, preprocessing and transmission of the sensor data. The main functional processing of the data collected motami carried out on the node, or gateway, which is a powerful computer.
For obtaining the data the node is equipped with the antenna. But accessible to a node there are only the motes who are close enough from it; in other words, the node does not receive the information immediately from each mote. The problem of obtaining of the sensor information collected by motes, dares as follows. Motes can exchange among themselves the information by means of the transceivers working in a radio-frequency range. It, at first, the sensor information which is read out from sensors, and secondly, the information on a state of devices and results of process of date transmission. The information is transferred from one motes to another on a chain, and as a result the motes nearest to the gateway drop to it the accumulated information. If the part of motes fails, operation of a sensor network after reconfiguration should proceed. But in this case, naturally, the number of sources of the information decreases. For execution of functions on everyone the mote is installed a specialized operating system. Now OS TinyOS which is developed at University of Berkeley is used.
To develop standards, including protocol stack for wireless sensor networks, ZigBee used previously developed standard IEEE 802.15.4, which describes the physical level and the level of media access for wireless data transmission over short distances (up to 75 m) with low power consumption, but with a high degree of reliability. Some characteristics of a radiobroadcast of the data for standard IEEE 802.15.4 are shown in table 1.
Table 1 - Characteristics of broadcast data for IEEE 802.15.4| Frequency band, MHz | license | Geographical region | Data transfer rate, kbps | Number of channels |
| 868,3 | No | Europe | 20 | 1 |
| 902-928 | No | America | 40 | 1-10 |
| 868,3 | No | Whole world | 250 | 11-26 |
In the operation beginning there is an identification of all motes, and the routing circuit then is formed. Generally all motes in standard ZigBee on complexity level break into three classes. The first and higher of them - the coordinator - controls network operation, stores the data about its topology and serves as the gateway for the date transmission, collected by all wireless sensor network, for the further handling. In sensor networks one coordinator, as a rule, is used. Motes concern a following class routers, they accept and transfer the data, and also can define a transmission direction. And at last, the most simple mote can transfer only given to the nearest router. Thus, it turns out that standard ZigBee supports a network with cluster architecture. A cluster form a router and the elementary motes of whom it requests the sensor data. Routers of clusters relay the data each other, and finally the data is transferred to the coordinator. The coordinator normally has connection with an IP-network where the data for final handling goes. At the development present stage in ZigBee protocol separately motes-routers and the elementary motes are in most cases incorporated in one which fulfills simultaneously both functions. An example of such topology it is represented in Fig. 2.
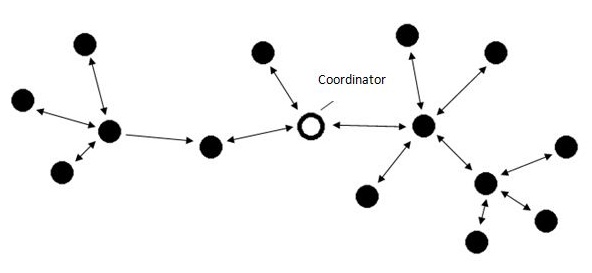
Figure 2 - Network Topology WSN
There are several emulators that can be used to simulate wireless sensor networks. The most famous are the NS2 and TOSSIM. Consider the key features of each.
NS2 is universal and can be used for simulating both wired and wireless networks. It simulates the network level and can not simulates the behavior of applications, so not quite suitable for sensor networks.
At the same time emits TOSSIM network operation at the bit level and is directly related to TinyOS. TOSSIM was designed specifically for simulation only wireless sensor networks. TOSSIM and NS2 focus on different aspects of the network and have a different architecture. Most appropriate to accomplish the task is to TOSSIM, so consider it in detail.
For development and testing of networks using an emulator TOSSIM. The emulator allows you to perform the same code as the real sensor nodes.
TOSSIM uses a very simple but incredibly powerful model of the wireless network. Network is represented as a graph in which each vertex - a wireless node and each arc between nodes is assigned a certain value - the probability of error. Each node has a local variable, which recorded the fact that he takes over the air.
TinyOS has component architecture, at the correct configuration providing the minimum code size that is very important for sensor devices which have strict restrictions on memory size. The library of components TinyOS includes network protocols, drivers of sensor controls and the utility of obtaining and information gathering which can be improved in client applications. Implemented in the TinyOS event model allows you to manage power at a low level, which saves power consumption. TinyOS moved more than a dozen platforms and numerous sensor devices.
As well as in the majority of other OS, in TinyOS the main controlling mechanism is event. Event signals about obtaining of indications of a sensor control, about arrival of a packet of the data on a wireless communication, about actuating of the timer or about completion of calculations. Handling of hardware event underlies all operations in TinyOS. Thus, primary goal TOSSIM - emulation of events for WSN which motes work under control of TinyOS. TOSSIM is installed on an ordinary PC with a set of tools needed to create, compile, install and debug applications for WSN. Working with these tools by using command line interface, which is characteristic of UNIX.
General characteristics of the emulator TOSSIM:
- scalability - the emulator can simulate the work as a separate reel, and the huge network consisting of several thousands of nodes;
- completeness - an emulator able to simulate various schemes of interaction of elements of the WSN, not only algorithms and network protocols, but also changing the structure of the sensor network
- accuracy - the emulator may represent the behavior of the network with the required accuracy. Determining the exact time of occurrence of events is important both for analysis and for testing applications for WSN;
- reliability - the emulator implements an adequate transition from simulated to real application execution environment, allowing developers to test code that is designed for real equipment
The composition of TOSSIM simulator includes the following elements:
- means incorporation of the application under test in the structure of TinyOS emulator;
- turn of events;
- a set of software components that replace the corresponding hardware components of real Motov;
- mechanisms for describing models of radio channels and an analog-digital converters (ADC);
- means of communication, offering the possibility of external programs to interact with the emulator.
Network structure it is possible to present in the form of the nondirectional graph, besides layout of motes is that that the network has the minimum quantity of intersections. It can be visualized by means of algorithm of drawing of graphs on the basis of physical analogies
Principal advantage of such method of drawing of the graph that it gives as a result good display of the graph. In most cases it builds the symmetric images of graphs. The method consists that the graph is considered as system of bodies with forces of interaction in between. Peaks of the graph consider as bodies, and edges springs. In that case the algorithm finds a configuration of bodies with local minimum energy - a so-called configuration of balance of forces in which each body takes of such position that the total of all forces enclosed to a body, is equal to zero. The idea is schematically represented in Fig. 3.

Figure 3 - The idea of using physical analogies
The visualization unit is developed in language Java and will be integrated to the program of emulation TOSSIM. At start of emulation the program on known topology will create the graph of a network and to visualize it. In the course of emulator operation messages generated TOSSIM will be intercepted and also to be listened ports which are used for emulation of a radiobroadcast of packets. On the basis of this data relocation of packets and informing on events happening on each mote will be displayed on the graph. Also the information on events will be deduced in a text format with filter possibility on an interesting category.
Due to the fact that the structure of WSN has a small number of crossings, the method of physical analogy to draw graphs will give a good result. In addition, this method allows you to quickly draw graphs and has a number of options with which you can easily influence the outcome.
- Kufmann M., Wagner D. Drawing Graphs. Methods and Models // Berlin Heidelberg - 2001, 325 c.
- Касьянов В.Н., Евстигнеев В.А. Графы в программировании: обработка визуализация, применение // С-П. - 2003, 1104 с.
- Levis P. TOSSIM: Accurate and Scalable Simulation of Entire TinyOS Applications // 2009, 23 с.
- Maneesh Varshney. Detailed Models for Sensor Network Simulations and their Impact on Network Performance // L-A. – 2006, 10 c
- Levis P. TOSSIM System Description // Los Angeles – 2009, 43 с.
- Karl H. and Willig A. Protocols and Architectures for Wireless Sensor Networks // John Wiley & Sons - 2005
- Сергиевский М. Беспроводные сенсорные сети. [Электронный ресурс] – Режим доступа: http://www.compress.ru/Article.aspx?id=17950
- Карабуто А. Сенсорные сети. [Электронный ресурс] – Режим доступа: http://offline.computerra.ru/2004/553/35459/
- Баскаков С. и Оганов В. Беспроводные сенсорные сети на базе платформы MeshLogic. [Электронный ресурс] – Режим доступа: http://www.meshlogic.ru/data/Meshlogic.pdf
- Официальный сайт TinyOS. [Электронный ресурс] – Режим доступа: http://www.tinyos.net/special/mission
When writing the abstract the Master's work was not completed yet. The date of completion is the December 1st 2011. Full text of the work and materials on the topic can be obtained from the author or his supervisor of studies after the date.