Master DonNTU Panchenko Olga Olegovna

Panchenko Olga Olegovna

Faculty: Computer sciences and technologies
Department: Computer systems of monitoring
Speciality: Computer-aided Monitoring Systems in Ecology and Economy
Topic: Solar activity and related geophysical parameters
monitoring information support system
Supervisor: Dean of CST, Ph. D., professor

Anoprijenko Aleksandr Yakovlevitch

Abstract of Thesis for a Master’s Degree in Computer Science

Solar activity and related geophysical parameters monitoring information support system

Introduction 1. The relevance of monitoring weather information on the example of solar activity 1.1. Objective and scientific innovation 1.2. Tasks 1.3. Expected practical results 2. Mobile Application Development 3. Conclusion 4. References Introduction Science long ago proved the failure of many ancient assumptions, but the fact of the strong dependence of life on earth from the sun was undeniable. Moreover, it was found that even minor changes in the state of the Sun, not related to its global evolution, impact on the Earth as a whole and on the lives of its inhabitants in particular. Therefore, Sun is under constant surveillance by astronomers. Solar activity is mediated effect on the psychological and physical well-being. Although many aspects of this connection has not yet fully understood, it is obvious: different manifestations of solar activity, such as magnetic storms, give an impetus that displays a weakened body out of balance, which can lead to serious consequences [ 6] . therefore pressing tasks are to establish and analyze the relation between solar activity and meteorological characteristics (air pressure and air temperature) during the peak of the current cycle of solar activity and analysis of existing data on the solar activity: the geomagnetic Ap- index, the quantitative and qualitative parameters of large solar flares observed in optical and X-ray spectral regions. 1. The relevance of monitoring weather information on the example of solar activity most interesting for us, the inhabitants of planet Earth are those processes and phenomena that cause disturbance near-Earth space - magnetic storms, proton events, when the earth comes a stream of charged particles of high energy, and ionospheric storm [3] . The main agents causing these disturbances are: for analysis and statistical processing of raw data we used the following methods:
  1. Correlation method.
  2. The method of superposed epochs.
  3. Statistical processing of results.
  4. Interpolation functions of two variables by the method of bicubic polynomials H. Akima.
  5. Image function of two variables by the method of parallel sections.
One of the authors previously developed a program on the algorithmic language FORTRAN, which was used to interpolate a function of two variables by the method of bicubic polynomials H. Akima, and construction of this function directly on the screen or printer [1] . analysis and statistical analysis showed that the third-fourth day after the passage of sunspots across the central meridian of the solar disk observed maximum decrease in atmospheric pressure. In the case where the temperature is not observed a clear dependence of temperature change with the passage of sunspots. physical mechanism explaining the dependence of the atmospheric pressure on the passage of sunspot groups, may be a change in the physical parameters of the interplanetary spheres associated with an increase in density and velocity of the solar wind. Reducing the pressure on third-fourth day after the passage of sunspot groups can be explained by the influence of solar wind on the Earth's magnetosphere. Were evaluated propagation velocity perturbations from the Sun to the change in atmospheric pressure. To do this, we took into account that the solar wind is moving along magnetic field lines of the interplanetary magnetic field, forming the structure of the pie. Given that the three days include 259 200 seconds (t), and the distance along the magnetic lines of force of the interplanetary magnetic field is 149.6 million km (S - the distance from Earth to the Sun), while the solar wind velocity V = S / t = 600 km / s. This value exceeds the average velocity of the solar wind on the Earth's orbit is 1.2 times (average velocity of the solar wind on the Earth's orbit V = 500 km / s). Thus, reducing the pressure on the third day after the passage of sunspot groups across the central meridian of the solar disk can be explained by the influence of solar wind on the Earth's magnetosphere. During solar maximum, a decrease in atmospheric pressure after passing a group of spots. The delay of the reaction at atmospheric pressure in the passage of sunspot groups is consistent with the time distribution of solar wind to Earth's orbit. The results obtained make it possible to predict the sharp variations in pressure, based on observations of sunspots. Forecasting and research in atmospheric pressure make it possible to predict cyclones, storms and squalls, which is of great interest to meteorologists and weather service. In addition, the influence of meteorological conditions affect the activity of the human body. main condition in the weather that affects the human brain and its activity is a significant disequilibrium [4] . The influence of weather is expressed more strongly, the more sharply and suddenly her change. Cyclones, their origin, in particular the approach to the place of observation and being in the zone of the cyclone should be recognized for almost all adverse conditions of the people, because they are worsening and relaxing way, giving the opportunity and impetus to the manifestation of a very serious effects and consequences of [5] . The study showed a statistically significant decrease in atmospheric pressure associated with the passage of large sunspot groups across the central meridian of the visible solar disk. However, a sharp drop in pressure was significantly greater. In a review of compliance with the moments of lower air pressure to the events associated with solar flares. During the study period 56 minima observed pressure. Of these, 42 events correspond to changing the sign of the polarity of the interplanetary magnetic field. Relationship with solar flares is complex and ambiguous. Only in 20 cases out of 69 failed to match the minima of pressure from solar flares. Application of superimposed epochs [8] , where for a day, taken Tetrad date of passage of sunspots across the central meridian, possible to distinguish the importance of X-ray flares score on this point. For weak flares is not observed due to the moment of passage of sunspots across the central meridian (Fig. 1). For outbreaks of average power maxima are observed flare frequency for 4 days prior to the passage of the central meridian (Fig. 2). After one and three days after the passage also observed an increase in the number of outbreaks. To some extent this may explain the decrease in atmospheric pressure after the passage of large groups of spots across the central meridian. However, it should recognize the importance of the electromagnetic channel effects of solar activity on Earth's atmosphere by ultraviolet radiation and soft X-ray. graph of the relative number of optical flares with respect to the frame of the day pretty much confirms this conclusion (Fig. 3). Outbreaks are concentrated to a maximum of three days prior to the frame, on the day of passing through the central meridian, and 3-4 days after this date. Thus can not explain the presence of high geomagnetic disturbance (Ap-index - quantitative and qualitative parameters of large and geoeffective solar flares observed in optical and X-ray spectral regions), which occurs 3-5 days after the date of passage of large sunspot groups across the central meridian disk the sun (Fig. 4). There is a correspondence between the greatest disturbance of the geomagnetic field of the Earth (the maximum mean Ap-index in Figure 4) and the minimum value of pressure.
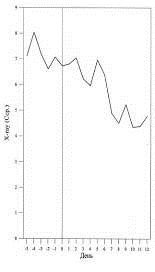
Figure 1
schedule due to the low power flash point of the passage of sunspots across the central meridian of the visible disk of the Sun
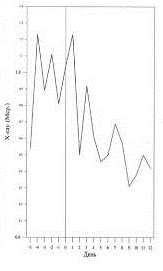
Figure 2
schedule due to outbreaks of the average power of the moment of passage of sunspots across the central meridian of the visible disk of the Sun
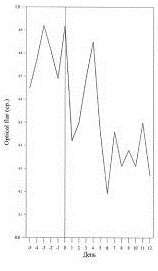
Figure 3: Graph of the relative amount of
optical flares with respect to the frame of the day
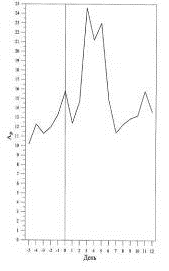
Figure 4: Graph
disturbance of the geomagnetic field of the Earth (AR-index)

Figure 5 – Step by step the construction schedule of disturbance of the geomagnetic field of the Earth

1.1. Objective and scientific innovation aim of this work is the analysis and selection of methods for monitoring information, solar activity, the assessment of the impact of individual parameters on geophysical processes and the development of an application that implements the information system to support these functions for different platforms, programming. 1.2. Tasks To achieve this goal in the research process should be:
  1. Overview of the problem of analysis of information and methods for monitoring solar activity.
  2. Analysis of individual parameters on the geophysical processes.
  3. analysis of the properties of different programming languages ​​and choice in terms of their properties, identification of leaders in various categories: desktop, online, mobile application.
  4. development programs charting the solar activity for each of the platforms on selected PLs.
  5. analysis methods of monitoring information in the databases of large dimension.
  6. design mobile application that implements a system of information support for monitoring solar activity.
1.3. Expected practical results further direction of our research work is connected with the connection software package, solar activity, provided by 3tier [14] , and add schedules depending on the application of atmospheric pressure on solar activity [15] . 2. Mobile Application Development To implement mobile monitoring solar activity, we developed a mobile application platform, Android, called SolarInfo. This appendix serves as a storage and analysis of data on weather conditions with reference to a specific time period. structure of the application can be divided into five main parts, according to which the application packages created:
  1. com.skychyn - the basic package, which includes classes aktiviti the main screen and the screen settings.
  2. com.skychyn.database - includes classes for working with databases.
  3. com.skychyn.webdata-charge of classes for working with sockets.
  4. com.skychyn.xml - contains classes to parse and analyze XML data.
  5. com.skychyn.draw - classes that are responsible for plotting the accumulated data.
application works as follows. At startup the user the opportunity to work with the main application window (Figure 6). On this screen are navigation buttons to the window, application settings, a button that triggers the mechanism for updating the database with information from the Internet, and the transition to a window plotting (Fig. 6 - 1,2,3). In addition, there is a field that displays the contents of the database at the current time (Fig. 6 - 4).
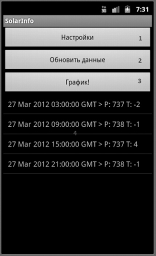
Figure 6
main application screen.
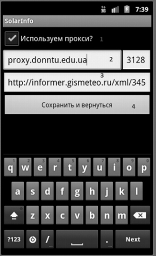
Figure 7
screen application settings.
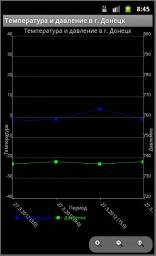
Figure 8: Screen
construction of graphical information.
application settings screen allows you to set-up network connection to a source of data on weather conditions. This screen contains the following controls. Checkbox to use a proxy server ( Figure 7 - 1). In case the activity of the control activated the address field and proxy port (Figure 7 - 2). Also there is an input field URL-address of the source data in XML (Figure 7 - 3). By clicking on the button (Figure 7 - 4) is saving your changes and return to the main application window. screen graphical display (Fig. 8) allows us to provide the accumulated information in the database as a graph, which will visually examine the possible dependence of the meteorological readings. 3. Conclusion A study of changes in meteorological parameters and their relation to the events on the Sun was found that the effect of solar activity on the synoptic events in the surface layer of the atmosphere is complex. Seen a sharp drop in pressure of 15-25 mm Hg. of Art., which can be associated with changes in "space weather" in the vicinity of the Earth. One-channel effects associated with both changes in speed and flux density of solar wind flowing around the magnetosphere, and with streams of solar cosmic rays during the development of powerful proton flares on the sun. The second channel is implemented with the direct effects of soft X-ray and ultraviolet radiation, which flows increase with increasing solar activity. The data analysis confirms the presence of both channels, affecting the earth's atmosphere. In the absence of flare activity changes the polarity of the interplanetary magnetic field becomes the dominant factor for the prognosis of sudden changes in atmospheric pressure. Therefore, the prediction of changes in meteorological parameters on the passage of large sunspot groups across the central meridian can be considered reasonable. It is these groups that develop with a complex structure of the magnetic field, are sources of X-ray and proton flares. Their location near the apparent center of the disc creates the conditions most geoeffectiveness. According to the present energy [6] , which is the solar wind, ultraviolet and X-rays, it is enough that the Earth's troposphere, began the development of cyclones and other processes that lead to a change in weather. Application of the developed software applications has enabled the study of meteorological readings while away from your computer that can be useful for field studies of solar activity. 4. References 1. Панченко О.О. Влияние солнечной активности на синоптические события начала XXI века: анализ данных для г. Донецка// В книге: «Тези доповідей XV ліцейської науково-практичної конференції». – Донецьк: ДонНУ, 2006. – С.16-17. 2. Панченко О.О. Солнечная активность и метеорологические процессы начала третьего тысячелетия: анализ данных для г. Донецка // В книге: «Физика и научно-технический прогресс. Тезисы докладов межвузовской студенческой конференции». – Донецк: ДонНТУ, 2007. – С.89. 3. Akima H. A new method of interpolation and smooth curve fitting based on local procedures. – ACM, 1970, V.17, № 4, p.589-602. 4. Витинский Ю.И. Солнечная активность. – М.: Наука, 1983. – С.192. 5. Владимирский Б.М., Темурьянц Н.А., Мартынюк В.С. Космическая погода и жизнь. – Фрязино: Век 2, 2004. – С.224. 6. Мирошниченко Л.И. Солнечная активность и Земля. – М.: Наука, 1981. – С.144. 7. Чемберлен Дж. Теория планетных атмосфер. – М.: Мир, 1981. – С.352. 8. Чижевский А.Л. Земное эхо солнечных бурь. – М.: Мысль, 1976. – С.367. 9. Анориенко А.Я. Нооритмы. – Д.: УНИТЕХ, 2009. – С.372. 10. Кассандрова О.Н., Лебедев В.В. Обработка результатов наблюдений. - М.: Наука, 1970. – С.104. 11. Уиттен Р., Попофф Дж. Основы аэрономии. – Ленинград: Гидрометеоиздат, 1977. – С.227. 12. Научно-исследовательская лаборатория физики Солнечно-Земных связей при Нижегородском государственном педагогическом университете [Электронный ресурс]. – Режим доступа: ежедневно / http://spacelabnnov.110mb.com 13. Обсерватория соединяющего [Электронный ресурс]. – Режим доступа: ежедневно / http://wwint.alfamoon.com/observ/index.php 14. 3TIER [Электронный ресурс]. – Режим доступа: ежедневно / http://www.3tier.com/en/package_detail/solar-prospecting-tools/ 15. Solar CS API Documentation [Электронный ресурс]. – Режим доступа: ежедневно / http://www.aiso.net/