
Abstract
Contents
- Introduction
- 1. Relevance of the topic
- 2. The purpose and objectives of the study, expected results
- 3. The analysis methods in terms of the problem
- 3.1 Cluster analysis
- 3.2 Typology of clustering problems
- 3.3 Overview of the method chosen
- 3.4 Approach to testing. Psychometry
- 4. Proposals for the structure of the master's work
- Conclusions
- Source List
Introduction
Decision support system designed to support multi-criteria decisions in a complex information environment. In this case a multi understood that the results of decisions are not judged by one, but by a set of multiple indicators (criteria), considered simultaneously.
Information complexity is determined by the need to account for a large amount of data processing, which without the aid of modern computer technology is almost impossible. Under these conditions, the number of possible solutions is usually very large, and selecting the best of them "by eye" without a comprehensive analysis can lead to gross errors. DSS solves two main tasks:
-selection of the best solutions from the set of possible (optimization);
-ordering of the possible solutions for the preference (ranking).In both problems, the principal point is the choice set of criteria based on which will be further evaluated and compared the possible (alternative) solutions. DSS system helps the user make that choice. DSS - a powerful tool with the decision maker. This is a unified system of data, models and tools to access them (interface). The role of DSS is not limited to storage and delivery of required reports. DSS are designed to improve people's knowledge through the use of information technology. In turn, the DSS can be divided into two types. This called management information systems (MIS), designed for immediate response to the current situation, and with a deep study of DSS data.
The results of the DSS, as a rule, is to provide guidance and forecasts, which are more heuristic in nature and are not necessarily a direct indication for further action.
To analyze and make proposals to the DSS uses a different method. Among them: information retrieval, data mining, the search for knowledge in databases, reasoning based on precedents, simulation, genetic algorithms, neural networks, etc. Some of them have been developed within the framework of artificial intelligence. If the system is based on one or more of these methods, we talk about intelligent decision support system (IDSS).
1. Relevance of the topic
Modern insurance business can not be imagined without efficient information technology, but the choice of optimal IT-solutions in the light of prospective and current business needs of the insurance company is still very difficult. Typically, this selection is based on a thorough analysis.
In addition to the classical problems in selecting an insurance company for life insurance, property and auto insurance, now in connection with the reforms in Ukraine in the fields of health care and pensions new questions arise selecting an insurance company. In particular, each will choose the best for a company for health insurance and private pension fund (II stage of pension reform). The development of non-state pension and medical insurance in Ukraine, bringing us closer to European standards of living, and also requires (a) modern, scientifically sound, reliable and effective choice of more suitable to every citizen of various types and areas of insurance.
So, the question of choosing an insurance company in the Ukraine at the current time is quite relevant, and a large flow of new domestic and foreign companies offer a wide range of services at different levels of reliability. To make the right choice in the variety of options should be reliable and at the same time easy to use tool for decision making.
2. The purpose and objectives of the study, expected outcomes
The aim is to develop a decision support system, providing convenient services to choose an insurance company that best satisfies the customer requirements.
To achieve this goal to solve the problem:
- Establish criteria for the classification of insurance companies;
- analyze clustering methods applied to the group of companies;
- develop test questions and fulfill their kriterizatsiyu on selected parameters;
- develop DSS.
3. The analysis methods in terms of the task
The above problem can be solved by carrying out a cluster analysis using adaptive neural networks, which adds dynamism and flexibility in the proposed model system.
3.1 Cluster analysis
Cluster analysis performs the following tasks:
- design typology or classification;
- study useful conceptual schemes of grouping objects;
- generating hypotheses based on research data;
- test hypotheses or studies to determine whether the types (groups) allocated one way or another, are present in the data;Use of cluster analysis involves the following steps:
- sample selection for clustering.
- definition of the set of variables, which will be judged by the objects in the sample.
- value calculation of a measure of similarity between objects.
- application of the method of cluster analysis to create groups of similar objects.
- validation results of the cluster solutions.Cluster analysis requires the following data:
- figures should not correlate with each other;
- indicators should be dimensionless;
- distribution rates should be close to normal;
- indicators should meet the requirement of "stability", which means the lack of influence on the values of random factors;
- sample should be homogeneous, free from "emission".If cluster analysis is preceded by factor analysis, the sample does not need to "repair" - stated requirements are fulfilled automatically by the simulation procedure, the factor (there is one more advantage - z-standardization without negative consequences for the sample, if it is carried out directly for the cluster analysis, it can lead to a decrease in sharpness division teams). Otherwise, the sample must be corrected.
Analysis and interpretation of results
In analyzing the results of sociological research methods is recommended to analyze the hierarchical aglomerativnogo family, namely the method of Ward, in which the cluster is optimized within the minimum variance, as a result of the clusters are of approximately equal size. Ward's most successful method for the analysis of sociological data. As a measure of the differences better than the quadratic Euclidean distance, which increases the contrast of the clusters. The main result is a hierarchical cluster analysis dendrogram or "sosulchataya chart." In its interpretation of the researchers are faced with the same kind as the interpretation of the results of factor analysis - the lack of definitive criteria for the selection of clusters. As the principal recommended that you use two ways - visual analysis and comparison of the dendrogram clustering results. Visual analysis dendrogram involves "cutting" the tree at an optimal level of similarity of samples. "Grape branch" (the terminology Oldenderfer' MS and Bleshfilds' RK) is appropriate "cut off" at around 5 scale Rescaled Distance Cluster Combine, so it will reach 80% level of similarity. If the selection of clusters for this tag is difficult (for it is the merger of several smaller clusters into one large), then we can choose a different label.
Now the question is the stability of cluster solutions adopted. Checking the stability of clustering reduces to verifying its authenticity. Here there is a rule of thumb - the typology remains stable when the clustering methods. Results of hierarchical cluster analysis can be checked iterative cluster analysis by the method of k-means. When comparing the classification of groups of respondents have a share of matches, more than 70% (more than 2/3 matches), the cluster solution was adopted.
Review the adequacy of solutions, without the help of another kind of analysis impossible. At least in theory, this problem is not solved. In the classic work of Oldenderfer and Bleshfild' "Cluster analysis" discussed in detail and eventually rejected by an additional five test methods of stability:
- tests of significance;
- procedure repeated (random) sample;
- tests for the significance of the external signs are only suitable for repeated measurements;
- Monte Carlo methods.
3.2 Typology of clustering tasks
Types of input data
indicative description of the objects. Each object is described by a set of its characteristics, called attributes. Symptoms can be numeric or nonnumeric.
matrix of distances between objects. Each object is described by the distances to all other objects of the training set. Objectives
clustering
understanding of data by identifying the cluster structures. Splitting the sample into groups of similar objects to simplify further processing and decision-making, applying to each cluster, a method of analysis (the strategy of "divide and conquer").
Data Compression. If the initial sample is excessively large, you can cut it, leaving one at the most typical representative of each cluster.
detection of novelty: stand atypical objects that can not be attached to any of the clusters.
In the first case, the number of clusters tend to do less. In the second case is more important to ensure a high degree of similarity of objects within each cluster, a cluster can be any number. In the third case of greatest interest are the individual objects that do not fit into any of the clusters.
In all these cases can be used hierarchical clustering, where large clusters are broken up into smaller ones, which in turn break up even smaller, etc. Such problems are called problems of taxonomy. The result of taxonomy
Woody is a hierarchical structure. In addition, each object is characterized by an enumeration of all the clusters to which it belongs, usually from large to small.
Among clustering methods allocate:
- K-means;
- fuzzy clustering method C-medium (C-means);
- graph clustering algorithms;
- statistical clustering algorithms;
- slgorithms family FOREL; Hierarchical clustering
or taxonomy
- Kohonen neural network;
- Ensemble klasterizatorov;
- KRAB family of algorithms;
- EM-algorithm;
- Algorithm based on a method of screening.Method K-means. Algorithm is a version of the EM-algorithm used for separating a mixture of Gaussian. He divides the set of elements of a vector space to a known number of clusters k.
The basic idea is that at each iteration recalculated the center of mass for each cluster obtained in the previous step, then the vectors are divided into clusters, again according to which of the new centers was close to the chosen metric.
Algorithm terminates when at some iteration, there is no change in the clusters. This occurs in a finite number of iterations as the number of possible partitions of a finite set is finite, and at each step of the total square deviation V is reduced, so the loop is not possible. As shown
D.Artur S.Vassilvitsky and, in some classes of sets of the complexity of the algorithm in time required for convergence, is equal to
Demonstration algorithm
Problems k-means: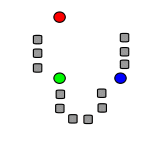
Figure 2 - Effect of the algorithm in two dimensions. The starting points are chosen randomly.
(animation: 4 frames, 10 cycles of repetition, 16 kilobytes)
Frame 1 - The original point and the randomly selected starting points.
Frame 2 - The points assigned to the initial centers. Partition of the plane -
Voronoi diagram with respect to the initial centers.
Frame 3 - Calculate new cluster centers (Find the center of mass).
Frame 4 - The previous steps are repeated until the algorithm does not come down.
- is not guaranteed to achieve the global minimum total quadratic deviation V, and only one of the local minimum;
- result depends on the choice of initial cluster centers, their best choice is unknown;
- number of clusters is necessary to know in advance.Widely known and used neural network implementation of the K-means - online vector quantization of signals (one version of the Kohonen neural networks).
Kohonen neural network - a class of neural networks, the main element of which is the Kohonen layer. Kohonen layer is composed of adaptive linear combiners ("linear formal neurons"). Typically, the output signals of the Kohonen layer are handled by the rule of "winner takes all": the largest signal is converted into a unit, and the rest vanish.
By means of setting the input weights adders and solved problems distinguish many kinds of Kohonen networks. The most famous of them:
- Network vector quantization of signals that are closely associated with the simplest basic algorithm of cluster analysis (method of dynamic nuclear or K-medium)
- Self-organizing maps of Kohonen (Self-Organising Maps, SOM)
- Network vector quantization, students with a teacher (Learning Vector Quantization). The method of fuzzy clusteringC-medium (C-means) enables you to split an existing set of vectors (points) with a power p on the specified number of fuzzy sets. Feature of this method is the use of fuzzy membership matrix U with elements uij, determining ownership of i-th element of the original set of vectors - j-th cluster. The clusters are described by their centers of CJ - vectors of the same space, which belongs to the original set of vectors.
In solving the problem of fuzzy C-means clustering to solve the problem of minimizing the following objective function E = ∑∑uijm • | | xi-cj | | ² with constraints ∑juij = 1, i = 1 .. p.
FOREL (formal element) - clustering algorithm based on the idea of combining into a single cluster of facilities in their areas of greatest accumulation. The purpose of clustering
Split the sample into an (unknown number) of taxa that the sum of the distances from the cluster of objects to cluster centers is minimized over all clusters. That is our task - to identify the group as close as possible to each other objects which, because of the similarity hypothesis, and will form our clusters.
How it works - at each step we randomly choose an object from the sample, blow up around the sphere of radius R, inside the sphere we choose the center of gravity and make it the center of a new sphere. Thus at each step we move the field toward the local accumulation of objects sample, that is, trying to grab as many objects of the sample sphere of fixed radius. Once the center of the sphere is stabilized, all objects within a sphere with the center, we mark both clustered and throw them out of the sample. This, we repeat the process until such time as the whole sample is not clustered.
Algorithm:
- Randomly selects a sample of the current object.
- Mark the sample objects at a distance less than R from the current.
- Calculate their center of gravity, mark the center as the new current object.
- Repeat steps 2-3 until the new current object does not match with the former.
- Mark objects within a sphere of radius R around the current object as a clustered, throw them out of the sample.
- Repeat steps 1-5 until all the clustered sampling.
choice of center of gravity: the linear space - the center of mass, in metric space - the object to which the sum of the distances is minimal among all within the sphere; object to a sphere of radius R contains the maximum number of other objects of the sample (slowly); object inside the sphere of small radius contains the maximum number of objects (of a sphere of radius R).
Observations:
- Prove convergence of the algorithm in a finite number of steps. In the linear space
- center of gravity may be a arbitrary point in space, metric - only the object of the sample.
- Smaller R, the higher taxa (clusters).
- In the linear space search is the center in time O (n), in a metric O (n ²).
- Algorithm achieves the best results on samples with good compliance with the terms of compactness.
- By repeating iterations may decrease the parameter R, for speedy convergence.
- Clustering depends strongly on the initial approximation (select an object in the first step).
- Recommended re-sweep algorithm to avoid the situation a "bad" clustering, due to an unfortunate choice of initial objects.
Benefits:
- precision to minimize the quality functional (with the successful selection of the parameter R);
- visibility imaging clustering;
- convergence of the algorithm;
- ability to cluster operations centers - they are known in the process of the algorithm;
- ability to count functionals of intermediate quality, for example, the length of the chain of local condensations;
- ability to test hypotheses and the compactness of the similarity in the process of the algorithm.Disadvantages:
- The relatively low performance (conversion function is solved introducing the center of the search by adding an object inside the sphere).
- Poor applicability of the algorithm in poor separability of the clusters in the sample.
- instability of the algorithm (dependent on the choice of the initial object).
- Arbitrary division into the number of clusters.
- Necessity of a priori knowledge of the width (diameter) clusters.After working the finished clustering algorithm can perform some actions:
- Select the most representative (representative) of objects from each cluster. You can choose the centers of clusters can be more than one object from each cluster, taking into account a priori knowledge about the representativeness of the sample required. TS ready for clustering, we are able to build a more representative sample Conversion.
- Clustering (mnogourovnenvost) using CNR.
Scope:
-Solving Clustering
-Solving ranking of the sample.Mathematically, a taxonomy is
Woody structure of the classifications defined set of objects. At the top of this structure - a single unifying classification - the root taxon - which applies to all objects of a given taxonomy. Taxa that are below the root are more specific classifications that apply to subsets of a common set of classified objects. Modern biological classification, for example, is a hierarchical system, the base of which consists of individual organisms (individuals), and the top - a comprehensive taxon, at different levels of hierarchy between the base and top are taxa, each of which is subject to one and only one of a higher taxon rank.
point of view, asserting that the human brain organizes its knowledge of the world in such systems, often based on the epistemology of Immanuel Kant.
EM-algorithm (born Expectation-maximization (EM) algorithm) - the algorithm used in statistics for finding maximum likelihood estimates of parameters of probabilistic models, in the case where the model depends on some hidden variables. Each iteration of the algorithm consists of two steps. On the E-step (expectation) is calculated the expected value of the likelihood function, while the hidden variables are treated as observed. On the M-step (maximization) is calculated the maximum likelihood estimator, thus increasing the expected likelihood, calculated on the E-step. This value is then used for the E-step to the next iteration. The algorithm runs until convergence. Often
EM-algorithm is used to separate a mixture of Gaussian.
3.3 Overview of the chosen method
Justification of the method chosen
solution of the problem with a strictly fixed set of criteria that describe the activities of insurance companies with a level of significance in describing the general situation would lead to a static model.
Network vector quantization of signals added to the solution of the dynamic clustering can be implemented adaptive composed model, which would make the system universal in addition a number of criteria and the degree of importance in describing the object as a whole. Also part of the output module can be realized by semantic rules.
detailed review of the method chosen Kohonen layer
consists of a number n of parallel existing linear elements. They all have the same number of inputs m and get their inputs on the same input vector x = (x1, ... xm). The output of the linear element jgo obtain a signal
Yi = Wj0 + ∑ Wij * Xi,
where Wji - weighting factor igo jgo input neuron, Wj0 - threshold factor. After passing through the layer
linear elements for processing the signals sent by the rule of "winner takes all": among the output signals Yj sought the maximum, its number jmax = argmax j {yj}. Finally, the output signal with the number jmax equal to one, the others - zero. If the maximum is achieved at the same time for several jmax, then either take all the appropriate signals equal to one, or just the first in the list (by agreement). "Kohonen neurons can be thought of as a set of light bulbs, so that for any input vector turns one of them." Kohonen self-organizing map
. The idea and the learning algorithm
vector quantization problem is, in essence, the best approximation of the entire set of data vectors k code vectors Wj. Kohonen self-organizing maps and approximate data, but in the presence of an additional structure in the aggregate code vectors (born codebook). It is assumed that a priori, given a symmetric table "neighborhood action" (or "up close") nodes: for each pair j, l (j, l = 1, ... k) defined by the number of ηjl () with the diagonal elements Tables are close to unity (ηjj = 1).
input vectors x are processed one by one, each of which is the nearest code vector ("winner" who "takes it all») Wj (x). After that all code vectors Wl, for which ηj (x) l ≠ 0, are translated by the formula
Wlnew = Wlold (1 - ηj (x) l * θ) + x * ηj (x) l * θ, where θ (0,1) - step instruction. Neighbours code vector - the winner (by a priori given a table next) move in the same direction as this vector is proportional to the extent of intimacy.
Most often, the table of code vectors is represented as a fragment of a square lattice in the plane, and the measure of proximity is determined based on the Euclidean distance in the plane. Kohonen self-organizing maps
serve primarily for visualization and the original ("Intelligence") analysis. Each data point shows the corresponding code vector of the lattice. So get on a plane view of the data ("data card"). On this map you can display many layers of data entering the nodes (ie, "data density"), various features of data and so on. When displaying these layers of the device is useful geographic information systems (GIS). In the GIS image information for the substrate layer is a geographical map. Map data is a substrate for the arbitrary nature of the data set. It is a replacement for a map of where it simply does not exist. The principal difference between the following: on the map adjacent objects have similar geographic coordinates on a map similar data objects have similar properties. With the data card can visualize the data, while putting on a substrate supporting information (signatures, annotations, attributes, informational coloring). Map also serves as the information data model.
3.4 Approach to testing. Psychometry
testing allows for the interaction of human needs with the capabilities of the system. A properly organized test gives the most accurate result.
testing requirements:
- Reliability and validity are relevant to the generalizability performance testing - determining what the conclusions of test parameters are reasonable. Reliability concerns the consistency of the findings of measurement. Consistency is defined in different ways: as a temporary stability, as the similarities between supposedly equivalent tests, as homogeneity in a single test or a comparable assessments handed down by experts. When you use the "test-retest" reliability of the test established by repeated its holding with the same group after a certain period of time. Then the two resulting sets of indicators are compared to determine the degree of similarity between them. When using the method of interchangeable forms, a sample of surveyed conducted two parallel measurements. The involvement of experts ("assessors") to assess the quality of parallel forms of the test gives a measure of reliability is called. reliability of the evaluators. This method is often used when there is a need for expert evaluation.
- Validity characterizes the quality of the conclusions obtained on the basis of the results of the measurement procedure.
- validity of the test is regarded as the ability to meet the goals and justify the adequacy of the decisions taken based on the result. It is not enough valid test can not be regarded as an instrument of measurement and used in practice, as is often the result could seriously affect the future of the test.
identify three types of validity tests.
Construct (conceptual) validity. It is necessary to determine if the test measures a property that has an abstract character, that is not amenable to direct measurement. In such cases, the creation of a conceptual model that would explain this property. This model and to confirm or deny the test.
Criterion (empirical) validity. Shows how the results relate to the test with some external criterion. The empirical validity exists in two forms: the current criterion validity - correlation of test results with the selected criterion, existing at the present time, the predictive validity of the criterion - the correlation of results with the criterion that will appear in the future. Determines whether the test predicts the manifestation of the measured quality in the future, taking into account the influence of external factors and intrinsic activity of the test.
content validity. Determines how it corresponds to a test domain, that is, whether it measures the quality, which is intended to measure, in a representative sample. To support the content validity of the test, it requires regular checks for compliance as well as the real picture of the manifestation of a particular quality may vary from the sample over time. Rating the content validity should proizvditsya expert in the subject area test.process validation test should not be a collection of evidence of its validity, and a package of measures to improve the validity of this.
Most jobs require analysis procedures: a) the registration number of the subjects gave a correct or incorrect response to a specific task, and b) the correlation of individual jobs with other variables, and c) test tasks for the systematic error (or "bias"). Proportion of subjects who coped with the task of test is called. Perhaps not quite accurate, the difficulty of the task. Way to improve the job - to calculate the percentage choosing each option, answer the multiple choice task, it is also useful to calculate the average index of the test subjects who chose each option.
These procedures allow the monitor to look plausible answers for untrained subjects, but did not seem right the most knowledgeable. The selection of tasks that are highly correlated with a measure of the full test, maximizes reliability as internal consistency test, whereas the selection of tasks that are highly correlated with the external criterion maximizes its predictive validity. A descriptive model of the analog of these correlations is called the characteristic curve of the job, in typical cases - is a plot of the percentage of subjects correctly answering the question of their total test indicator. For an effective job of these graphs represent the positive upward curve, not declining as growth ability.
Psychometric area associated with a quantitative approach to the analysis of test data. Psychometric theory provides researchers and psychologists, the mathematical models used in the analysis of responses to individual tasks or items of tests, tests in general, and test suites. Applied Psychometry deals with the application of these models and analytical procedures to the specific test data. Four areas of psychometric analysis is normalization and equalization, estimation of reliability, validity assessment and analysis tasks. Each of these areas contains a set of certain theoretical principles and specific procedures used in evaluating the quality of the test in each case.
Rationing test - part of their standardization usually involves a survey of a representative sample of persons, the definition of different levels of performance tests and raw test scores translate into the overall system performance. Tests are sometimes equated, when there are different forms of the same test. Equating the results on all forms of assessment to a common scale.
are the main strategy of equating: The first method involves carrying out each test in the form equivalent (for example, randomly selected) group of respondents, and then the evaluation of these different forms that are installed on. to equal estimates were equal to percentile ranks (the same proportion of respondents receive the same or lower estimate), with a more accurate method of all respondents fill out all forms of the test, and to determine the equivalence of the equation parameters are used, the third commonly used method involves carrying out a general test or the test of all respondents, the overall evaluation procedure serves as a "binding" test, which allows all subsequent measurements tied to a single scale, the survey through various forms of the same in each test included a few "anchor assignments," performing the function of such a "binding" test.
4. Proposals for the structure of the master's work
The structure consists of the implementation of 3 phases:
- building a knowledge base;
- clustering criteria of insurance companies;
- the mechanism of decision (choice).Selection criteria of the company can be described as:
minL = ∑ (KiL-∑Kijn) ²,
where KiL-set, which experts describe the success of the insurance company, Kijn - j-th element of which is chosen by the respondent of the test. Thus it becomes possible to maximally accommodate the interests and needs of the individual in choosing an insurance company.
In future we plan to review and consider the possibility of using an adaptive neural network training as part of the developed system. Identify problems with the training of the National Assembly when adding new criteria to find solutions. A talk with the experts in the field of consulting services in the insurance and financial investment to determine the degree of importance of each criterion in the description of the activities of insurance companies.
Conclusions
In the course of the research work was studied the object of computerization, the ways of his automation and the necessity of developing a new system; analyzed by methods of cluster analysis, Kohonen neural network model.
Further actions are determined by the need to develop mathematical and algorithmic models of the functioning and development of software architecture, suitable for practical implementation of the system.
In economically developed countries the process of selecting an insurance company for one person, company, and the whole industry by consulting firms. This is a disinterested organization that is deeply and comprehensively study the needs of the customer, impartially and thoroughly analyze the proposal, capabilities and performance of multiple insurance companies, and make the choice of optimal variant of the insurance company.
For such a complex and very important work and need an affordable, flexible and effective system, as described in the paper. As the market of insurance services and consulting in Ukraine, it will be more and more popular in our country.
This system can also be successfully applied when choosing a bank, investment company and hedge fund.
There remains a number of issues to be resolved by further analysis of the subject area, select the static component of the mathematical model and part of what is necessary to analyze and process the dynamic methods that allow a more flexible system.
In writing this essay master's work is not yet complete. Final completion: December 2012. The full text of the and materials on the topic can be obtained from the author or his head after that date.
Source List
- Системы поддержки принятия решений. IT Спец [Электронный ресурс]: Режим доступа :URL: abc.org.ru/
- Business Intelligence [Электронный ресурс]: Режим доступа :URL: ru.wikipedia.org/wiki/Business_Intelligence
- Кластерный анализ [Электронный ресурс]: Режим доступа :URL: ru.wikipedia.org/wiki/Кластерный_анализ
- Нейронная сеть Кохонена [Электронный ресурс]: Режим доступа :URL: ru.wikipedia.org/wiki/Нейронная_сеть_Кохонена
- Комплексные программные решения EPAM Systems [Электронный ресурс]: Режим доступа :URL: epam-group.ru/solutions-EPAM_solutions.htm
- Нейронные сети [Электронный ресурс]: Режим доступа :URL: gotai.net/documents-neural_networks.aspx
- Внедрение информационных технологий как один из путей повышения эффективности деятельности страховой компании [Электронный ресурс]: Режим доступа :URL: economic-innovations.com/article/introduction_information_technology_as_one_way_enhancing_effectiveness_insurance_company
- K-means [Электронный ресурс]: Режим доступа :URL: K-means - Википедия
- How many kinds of Kohonen networks exist? [Электронный ресурс]: Режим доступа :URL: faqs.org/faqs/ai-faq/neural-nets/part1/section-11.html
- Самоадаптирующиеся нейронные сети [Электронный ресурс]: Режим доступа :URL: 314159.ru/neuroinformatics.htm
- Методы многомерной классификации и сегментации. Кластерный анализ [Электронный ресурс]: Режим доступа :URL: nickart.spb.ru/analysis/cluster.php
- Адаптивные сети и системы. Нейронные сети [Электронный ресурс]: Режим доступа :URL: neuronet.narod.ru/
- Обучение без учителя [Электронный ресурс]: Режим доступа :URL: ru.wikipedia.org/wiki/Обучение_без_учителя
- Психометрия [Электронный ресурс]: Режим доступа :URL: ru.wikipedia.org/wiki/Психометрия
- Рейтинг страховых компаний Украины [Электронный ресурс]: Режим доступа :URL: forinsurer.com/ratings/nonlife/
- Кластерный анализ [Электронный ресурс]: Режим доступа :URL: statsoft.ru/home/textbook/modules/stcluan.html
- Факторный анализ — Википедия [Электронный ресурс]: Режим доступа : URL: ru.wikipedia.org/wiki/Факторный_анализ