
Abstract
Content
- Introduction
- 1. Research problem statement
- 2. The algorithms applied to processing breast radiography images
- 3. The review of researches and workings out
- 3.1 Detecting of edges of new growths
- 3.1.1 Segmentation of roentgenograms by a method of approximations of difference of brightness
- 3.1.2 Algorithm of allocation of edge of the image operator Sobelja
- 3.1.3 Comparative analysis of methods
- 3.2 Detecting microcalsification on mammogram
- Conclusions
- References
Introduction
Now one of the most widespread oncological diseases among the female population is the breast cancer, the most effective treatment which occurs in that case if it has been diagnosed at early stages what probably to make only at passage mammography which results to process in the shortest terms it is possible by means of computer processing of x-ray pictures.
Breast radiography is the basic method of an objective estimation of a condition of breast. This technique of radiological research allows distinguishing in due time pathological changes in breast in 95-97 % of cases. Recently in the literature there were messages that mammography can promote cancer development. However serious researches, including native, have denied it. Now all over the world women are more senior 40 years pass mammography each 2 years, after 50 years - every year.
Mammography - a highly effective and safe method of the research, allowing revealing tumoral formation that insignificant the small sizes which is not shown clinically. Early diagnostics plays an important role in realization of timely treatment as result the probability of an absolute recovery becomes high, in most cases at preservation of breast [1].
1. Research problem statement
In connection with steady growth of disease by a breast cancer, diagnostics and treatment of this disease for today is one of the main problems of clinical oncology. According to statistics, annually in the USA and the developed countries of Europe comes to light over 900.000 new cases of a cancer of breast. From oncological diseases the cancer of a breast has come out on top in structure of disease and death rate of the female population of Ukraine. On the average the risk to be ill with breast cancer every tenth woman has. Considering it, the basic direction modern mammology still is search of ways of early diagnostics of breast cancer.
The primary goal of this work is creation a new software product of definition of pathological changes of breast which would be independent of any concrete installations, would define places of pathological changes with co-ordinates of their arrangement, independently would count the sizes of pathologies and did a conclusion about possible further diagnostics, and also formed the corresponding report.
Main objective is working out of specialised computer system which will define pathological changes of breast on the received x-ray pictures.
The images of breast received by removal of the roentgenogram will be object of research in the given work. The basic requirements to computer system of processing of such images are: accuracy, speed of data processing, adaptability to processing of various types of pathologies.
Subject of research are methods of processing x-ray pictures of the breast, allowing defining presence of new growths and degree of their high quality.
Tasks for creation of specialised computer system of definition of pathological changes of breast on x-ray pictures can be formulated as follows:
- preliminary analysis of the image;
- choice of methods of processing of the image;
- development of the corresponding software;
- calculation of parameters of pathological sites;
- formation and transfer of the corresponding report to the doctor;
- approbation of system for definition of efficiency of its work.
2. The algorithms applied to processing breast radiography images
Today in the world various systems of the computer analysis of digital roentgenograms, algorithms and programs of search and detailed elaboration of various signs of malignant processes are developed and used.
The estimation mammogram system - ImageChecker M1000 System - makes the computer analysis digital mammogram for revealing of microcalcification and dense weights of a tumour as gradients of intensity of pixels of the image with resolution of 50 micron in a 12-bit grey scale. Difficult visions, such as spicules, are analyzed by neural networks. At joint scanning with radiologists the system improves sensitivity mammography on 8% so the general sensitivity reaches 88%. In the specified system the powerful computer technics for image processing is used, at the analysis of one picture is spent approximately to 1 billion operations.
English researchers describe specific models “spicules” defeats in which pathological samples of linear structures and the central weights on mammograms are analyzed. Linear structures were detected with use of the factorial analysis for division of regular and casual features of samples classes. The central weights were divided on recursive median filtering with use of signs of local orientation. For “spicules” defeats in the sizes in 16 mm and the big samples sensitivity of 80% to 1,4% false-positive data is defined. Definition of weights detection has sensitivity of 80% to 23% false-positive data on the image.
The Californian researchers use for search of microcalcification on mammograms медианную a filtration for the automatic analysis of morphology of a grey scale from 20 % false-positive results. Analyze digitized mammograms with pixel 70 both 35 micron and depth of a grey scale 4096 (12 bits). The algorithm defines microcalcification which the radiologist can pass. Each object is classified on three categories: good-quality microcalcification, suspations and artefacts. The data is represented to the radiologist for the subsequent conclusion [2].
The analysis of a radiological picture has shown that problems which are necessary for deciding that the doctor the radiologist would make the authentic diagnosis, it is possible to reduce to the following:
- Increase of contrast (quality) of mammograms;
- Detecting of edges of new growths;
- Detecting microcalcification on mammograms;
- Classification (recognition) of the found out formations.
Contrast of the image can be increased simply, increase or a stretching of multiscale maxima of a gradient of the image. If work occurs with wavelet in factors them change a method of adaptive alignment of the histogram. Images with the raised contrast provide thin details of fabrics which are visible with labour-consuming contrast/brightness window methods. The contrast increase is made by any method even the classical linear.
Considering that microcalcification correspond to high-frequency components of a spectrum of the image, their detection is carried out by decomposition mammogram on various frequency strips, then choke subline of low frequency, then for restoration mammogras are used subline only high frequencies. As detection microcalcification can be made and with use wavelet-frames, the operator of improvement and suitable technology of reconstruction. Or it is possible to use a method based on superfluous discrete wavelet-transformation because of its good properties: a constancy of shift and numerical error firmness. This procedure consists of 3 steps: removal low-frequency components of a dense histic, a filtration of noise and visibility improvement microcalcification. As there is also a set of other methods based on qualifiers of neural networks, application adaptive wavelet, to the technician of optimum weighing wavelet-packages and ect.[3]
For classification of the found out formations it is possible to use also wavelet-methods, such as: the Multiscale statistical approach to the structure analysis, for classification microcalcification on good-quality and malignant, taking the multiscale statistical signs of a structure based on a matrix of joint occurrence, and as wavelet-structure signs, in the areas of interest containing microcalcification. And decomposition factors skeyling functions on some scale i.e. when at great values of scale skeyling function approximates delta function, the approximation error is minimised at the expense of use of genetic algorithm [4].
3. The review of researches and workings out
3.1 Detecting of edges of new growths
3.1.1 Segmentation of roentgenograms by a method of approximations of difference of brightness
Suppose that the initial image has passed all stages of the coding which result is the discrete digital image of a kind {fij} (I=0,1,…, N-l; J=0,1,...,M-1), where N and M - number of elements of the image on a vertical and a horizontal, accordingly; fIJ - value of brightness of an element of the image both I-th line and J-th column. In actual practice the digital image represents a mix of the ideal image and a hindrance which it is considered not correlated and Gaussian. Then the element of the digital image represents an additive mix of the ideal image and noise.
Let's enter system of continuous co-ordinates XY and a step Δх on an axis and Δу - on axis Y. Then set elements fIJ in system XY settle down with co-ordinates (I*Δу,J*Δх).
We approximate contrast difference in a sliding window in the size n•m a straight line. However, it is necessary that the line passes through the fixed point with co-ordinates х0, у0. Introduction of the fixed point allows reducing twice almost number of parametres which are subject further to estimatio [6]. Taking into account the accepted assumptions the model of difference of brightness looks like (1).
 |
(1) |
where 
α - a difference direction;
A - vague part of difference;
h - difference displacement.
Difference parameters α, A, h оare defined proceeding from a minimum of an error of approximation of real difference of brightness. The error of approximation of discrete values {fij}r, belonging vicinities in radius r and the centre in a point (х0,у0) is defined by expression (2).
 |
(2) |
where

Nr - number of elements of set {fij}r.
3.1.2 Algorithm of allocation of edge of the image operator Sobelja
Process is based on simple moving of filter mask from a point to an image point. In case of a linear spatial filtration the response is set by the sum of product of factors of the filter on corresponding values of pixels in the area covered with a mask of the filter. At detection of differences of brightness discrete analogues of derivatives of the first and second order are used. For simplicity of a statement one-dimensional derivatives will be considered.
The first derivative of one-dimensional function f (x) is defined as a difference of values of the next elements (3).
 |
(3) |
Similarly, second derivative is defined as a difference of the next values of the first derivative (4).
 |
(4) |
Calculation of the first derivative of the digital image is based on various discrete approximations a two-dimensional gradient. By definition, the image gradient ∇f (x, y) in a point (x, y) is a vector (5).
 |
(5) |
As it is known from a course of the mathematical analysis, the direction of a vector of a gradient coincides with a direction of the maximum speed of change of function f in a point (x, y).
The important role at detection of contours is played by the module of this vector which is designated ∇f (gradient) and is equal (6).
 |
(6) |
The direction of a vector of a gradient also is the important characteristic. We will designate α(x,y) a corner between a vector direction ∇f in a point (x, y) and an axis x which is calculated by the formula (7).
 |
(7) |
To calculate an image gradient it is possible, having calculated sizes of private derivatives ∂f/∂x and ∂f/∂y for each point.
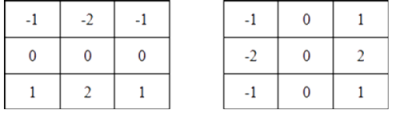
Operator Sobelja uses image area 3х3 and uses weight factor 2 for average elements (8).
 |
(8) |
This increased value is used for reduction of effect of smoothing at the expense of giving большего weight to average points [7].The masks used by operator Sobelja:
3.1.3 Comparative analysis of methods
It is possible to result the comparative analysis of a way of segmentation and based on gradients allocation of differences with use of operator Sobelja. For a numerical estimation by comparison the indicator of correct classification of boundary (9) and not boundary points (10) is used.

where Nr - number of points correctly classified as boundary, NH - number of points correctly classified as not boundary, N0 - number of boundary points, N-number of points within the two-dimensional image [8].
Table 1 – The results of Comparative methods of edge detector.
| The way of segmentation | α | β |
| Operator Sobelja | 0,9 | 0,91 |
| Approximating approach | 1 | 0,998 |
On the basis of the resulted results it is possible to confirm: Approximating the approach minimizes number of ruptures in object contours on the image that is defining in favor of an offered way of segmentation.
3.2 Detecting microcalsification on mammogram
On x-ray mammograms pictures microcalcification look as thin and bright stains, the size from 0,1 to 0,6 mm, and are in area of a dense fabric of mammary glands that does their almost invisible [9].
Search process of microcalcification is made under the following scheme:
- Improvement of quality of the image: a filtration by means of wavelet -transformations (Dobeshi of 2nd level);
- Definition of area of interest by means of use of statistical characteristics of the third and fourth usages: an excess and asymmetry;
- Indistinct clustering for allocation of central structures on region of interest;
- Central selection, for to allocate the valid areas microcalcifications on parametre: density of cluster and a thickness clustering.
More detailed description of the given methods searching of microcalcification shown in paper [10],and results of performance shown in drawing 1.
")
Drawing 1 - Rezut
Conclusions
At the moment of a writing of the given abstract from offered above 4 points of processing of the image mammograms the choice of a method of allocation of edge of a new growth, and the description of algorithm of allocation microcalcification on mammograms have been made.
This master's work is not completed yet. Definitive end: December, 2013. The full text of work and materials on a theme can be received at the author or its head after this date.
References
- Терновой С.К. Лучевая маммография / А.Б. Абдураимов, С.К. Терновой – М.: «ГЭОТАР-Медиа», 2007.
- Останькович А.А., Методы обработки маммограмм для выявления скрытых процессов в молочных железах/ А.А. Останькович, С.Д. Вайман, А.П. Тананакин, В.В. Небрат, А.И. Ходанов// Радиология – Новосибирск, 2003.
- Смоленцев Н.К. Основы теории вейвлетов – М: ДМК Пресс, 2005.
- Пикар Д. Вейвлеты, аппроксимация и статистические приложения// перевод К.А.Алексеев - ПГУ, Пенза, 2002.
- Гонсалес Р. Цифровая обработка изображений / Р. Гонсалес, Р. Вудс. – М.: Техносфера, 2005.
- Хюккель М. Оператор нахождения контуров на кодированных изображениях. // Интегральные роботы. - М.: Мир, 2003.
- Буй Т.Т.Ч. Анализ методов выделения краев на цифровых изображениях/ Т.Т.Ч. Буй, В.Г. Спицын// М.: Техносфера,2010.
- Senthilkumaran N. A. Study on Edge Detection Methods for Image Segmentation // N. Senthilkumaran, R. Rajesh // Proceedings of the International Conference on Mathematics and Computer Science – 2009.
- Лучевая диагностика. Заболевания молочных желез / Уве Фишер, Фридеман Баум, Сузанне Люфтнер-Нагель ; пер. с англ. ; под общ. ред. чл.-кор. РАМН, проф. Б.И.Долгушина. – М. : МЕДпресс-информ, 2009.
- Доценко В.В. Выбор метода определения патологических изменений молочной железы по рентгеновским снимкам/ В.В. Доценко, Е.В. Меркулова// Донецьк, ДонНТУ — 2013.