Abstract
Jian Ding and George Sperling. A gain-control theory of binocular combination.
In binocular combination, light images on the two retinas are combined to form a single “cyclopean” perceptual image, in contrast to binocular rivalry which occurs when the two eyes have incompatible (“rivalrous”) inputs and only one eye`s stimulus is perceived. We propose a computational theory for binocular combination with two basic principles of interaction: in every spatial neighborhood, each eye (i) exerts gain control on the other eye's signal in proportion to the contrast energy of its own input and (ii) additionally exerts gain control on the other eye's gain control. For stimuli of ordinary contrast, when either eye is stimulated alone, the predicted cyclopean image is the same as when both eyes are stimulated equally, coinciding with an easily observed property of natural vision. The gain-control theory is contrast dependent: Very low-contrast stimuli to the left- and right-eye add linearly to form the predicted cyclopean image. The intrinsic nonlinearity manifests itself only as contrast increases. To test the theory more precisely, a horizontal sine wave grating of 0.68 cycles per degree is presented to each eye. The gratings differ in contrast and phase. The predicted (and perceived) cyclopean grating also is a sine wave; its apparent phase indicates the relative contribution of the two eyes to the cyclopean image. For 48 measured combinations of phase and contrast, the theory with only one estimated parameter accounts for 95% of the variance of the data. Therefore, a simple, robust, physiologically plausible gain-control theory accurately describes an early stage of binocular combination.
binocular vision | neural networks | perception | rivalry | vision
When different images are presented to the left and right eyes, only a single, combined “cyclopean” image is perceived. Let IL(x, y) and IR(x, y) be the images presented to the left and right eyes, respectively, and I(x, y) be the perceived cyclopean image. The problem is to find a binocular combination functional Г that maps two input images IL(x, y) and IR(x, y) into a single perceived cyclopean image I(x, y), i.e.,
Model
Constraints. We propose a solution for binocular combination Г that satisfies three conditions.
- In natural vision for stimuli well above threshold, when either eye is stimulated alone, the cyclopean image is the same as when both eyes receive the same stimulus, i.e., for any such image I.
Note that constraint 1 does not distinguish very different possible ways of binocularly combining identical images to satisfy the constraint. For example, only one eye's image is selected (perfect rivalry), or both eyes' images contribute equally to the perceived cyclopean image, or some other combination rule. The experiments described herein demonstrate that “equal combination” is the rule; this fact is embodied in the proposed model.
- Г should describe the perceived cyclopean image for experimental data in which different images to the two eyes vary in contrast (“strength”) and content.
- The theory is restricted to the combination of images within a relatively narrow spatial frequency band, and to the influence of stimuli in other spatial frequency bands on this combination. It does not address the more complex issue of how images in different spatial frequency bands combine.
The following presents a sequence of successively more complex models to illustrate the steps by which we arrived at a Г that satisfies the above constraints.
Model 1: Linear Summation. The simplest case for binocular combination is simple linear summation. Suppose, as shown in Fig. 1, that, within a narrow spatial frequency band, the cyclopean image is the sum of two images presented to two eyes, i.e.,
Obviously, the linear summation model fails the first constraint Eq. 2. For example, let I be any image. When I is presented to only one eye, from Eq. 3 we have Г(I, 0) = Г(0, I) = I. When I is presented to both eyes, Г(I, I) = 2I, and that contradicts constraint 1 (Eq. 2).
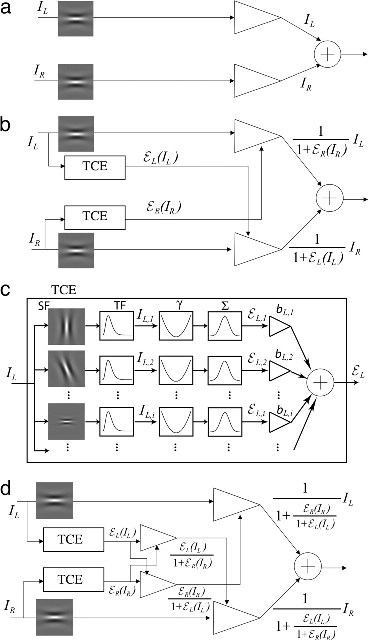
Fig. 1. Binocular combination models. The models consider the cyclopean image produced within a horizontal spatial frequency channel centered at 0.68 cpd as influenced by signals from other spatial-frequency-and-orientation channels. (a) Model 1: A linear summation model. Arithmetic summation of the two eyes`inputs produces the cyclopean image. (b) Model 2: Linear summation plus gain control. Each eye exerts gain control on the other eye in proportion to its own total visually weighted contrast energy (TCE). Within a spatial-frequency-and-orientation channel, the input from each eye is divided by a gain-controlling signal from the other eye (1 + TCE) and the two dividends are summed linearly. (c) Computation of TCE for gain control. The input signal to each eye (left eye is shown) is processed separately within each spatial-frequency-and-orientation channel. Within such a channel i, the input signal is temporally filtered (TF), then full-wave rectified with an exponent у and summed (a relatively large-extent, space-constant and long-duration time-constant, spatiotemporal filter, and summa), to produce that channel's visually weighted contrast energy for gain control EL,i(I L). TCE is the weighted sum over all spatial-frequency-and-orientation channels. The gain-control weights b i are specific to an output channel (e.g., the horizontal channel centered at 0.68 cpd). (d) Model 3: Linear summation plus gain control plus gain control of gain control. Each eye (i) exerts gain control on the other eye in proportion to the TCE of its own input and (ii) exerts gain control on the other eye's TCE.
The linear summation model also fails to account for experimental data. In the experiment described below, we find that the eye presented with a higher-contrast stimulus has more influence on the cyclopean image than would be predicted by simple linear summation.
Model 2. For left- and right-eye images IL and IR, model 2 proposes that each eye exerts gain control on the other (Fig. 1b) [e.g., Cogan's model (1) and the initial stage of Wilson's binocular rivalry model (2)]:
where eL(IL) and eR(IR) are the total visually weighted contrast energies for gain control (TCEs) of the two input images. Fig. 1c illustrates the calculation of TCE.
Suppose that identical images I are presented to each eye and, therefore, that the TCE for each eye is the same, eL(I) = eR(I). From Eq. 4 it is obvious that Г(I, I) becomes a smaller and smaller fraction of Г(I, 0) as TCE increases above 1. For example, consider a simple sine wave in each eye for which e is simply proportional to stimulus contrast. That the perceived cyclopean sine wave becomes increasingly weaker relativeto a monocular sin wave as e > 1 increases is an obvious violation of fact.
Model 3. Although Eq. 4, which describes model 2, obviously fails as written, replacing the gain-controlling terms eL(IL) and eR(IR) with terms that were normalized to 1 might remedy the difficulties. This observation motivates model 3 (Fig. 1d). In every neighborhood, each eye (i) exerts gain control on the other eye in proportion to the strength of its own input and (ii) exerts gain control on the other eye's gain control.
Eq. 5 can be rewritten as:
For identical images I presented to each eye, from Eq. 6 we have Г(I, 0) = Г(0, I) = I, and Г(I, I) = I(2 + 2Еj(I))/(1 + 2ej(I)), where j = L, R. For ej(I) >> 1, Г(I, I) = I, Г(I, I) asymptotically approaching I as ej(I) increases. Therefore, model 3 asymptotically satisfies the first constraint Eq. 2. Below, we will show that model 3 also gives an accurate account of our experimental data and, in so doing, that ej(I) >> 1 for image contrasts of 0.05 or greater.
Experiment 1
In all of the experiments reported herein, we take advantage of a simple mathematical fact: The arithmetic sum of two sine waves of the same wavelength is again a sine wave of the same wavelength whose amplitude and phase depend on the phases and amplitudes of the two component sine waves. It is both reasonable to assume and empirically observed that the cyclopean image of two parallel monocular sinewave gratings of the same wavelength is indeed, to a very close approximation, a sinewave grating of the same wavelength. Therefore, in this instance, predicting the combined cyclopean image is equivalent to predicting the apparent phase and amplitude of the cyclopean sine wave. The relative contribution of each eye to the cyclopean sine wave is easily determined from the perceived phase of the cyclopean sinewave grating. Fig. 2 illustrates our procedure for measuring the perceived phase of a cyclopean sinewave grating when two sinewave gratings of different contrast and different phase are presented to two eyes, respectively.
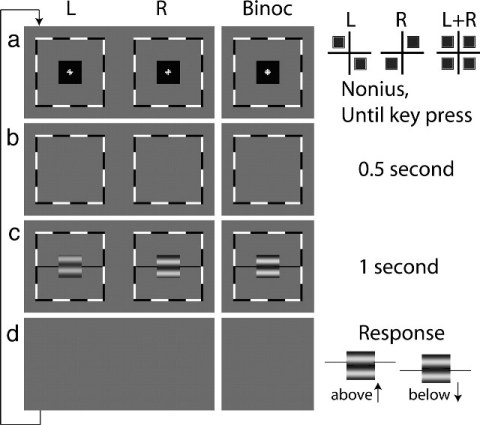
Fig. 2. Procedure. The two columns “L” and “R” show the sequence of stimuli presented to the left and the right eyes. The column “Binoc” represents the cyclopean image perceived by an observer. (a) Two fixation crosses, each with two dots, presented to two eyes and arranged so that with correct vergence, a single cross with four symmetrically placed dots is perceived. Details of the pattern of fixation crosses are shown at Right. This pattern (a Nonius) uses the perceived cyclopean view to indicate precisely where the observer's eyes are pointed. Once the observer perceives a pattern of four equal dots, it indicates correct fixation, and he presses a key that produces b. (b) A blank screen with surrounding frames lasting for 0.5 s. (c) Two horizontal sinewave gratings of different contrasts (contrast ratio б) and of different phases (phase difference Q) are presented to two eyes for 1 s together with black horizontal reference lines adjacent to the edges of the gratings. (d) A blank screen persists until a response is made. (Right) Example stimuli and the observer's possible responses depending on whether the horizontal reference lines appear to be above or below the center of the dark stripe in the perceived cyclopean sine wave. Possible position biases to respond “above” or “below” are cancelled by using four display conditions to define a single condition of phase Q and contrast ratio б (see text for details).
Stimuli. A horizontal sinewave grating is presented to each eye. Eqs. 7 and 8 and Fig. 2 describe the stimuli to the left and right eyes, respectively,
In all trials of the experiment, spatial frequency fs was fixed at 0.68 cycles per degree (cpd) and there were exactly two cycles visible in each eye's sine wave.
Procedure. Every trial begins with a uniform field of luminance L0, presented to each eye upon which a black fixation cross with two dots is arranged so that with correct vergence, a single cross with four symmetrically placed dots is perceived (Fig. 2a). Once a single cross with four symmetric dots is clearly perceived, the subject presses a key to continue the trial. The key press produces a blank screen (Fig. 2b) of luminance L0 for 0.5 s, then 1 s of sinewave gratings to the two eyes (Fig. 2). The blank screen is restored until the observer responds. The observer's task is to indicate the apparent location of the dark stripe in the perceived cyclopean sine wave relative to black horizontal reference lines adjacent to each edge (Fig. 2c). When the reference line is judged above the dark cyclopean stripe, a key press indicating “above” is made; otherwise the “below” key press is made (Fig. 2d). After the response, the cross-plus-four-dots fixation image for the next trial appears. As shown in Fig. 3a, in all displays a sine wave is presented to one eye with phase shift Q/2 above the midline and to the other eye with phase shift –Q/2 below the midline, thereby producing a relative phase shift Q between the images in the two eyes. The higher-contrastsine wave has contrast бm, 0 < m <= 1; the other sine wave has contrast бm, 0 <= б <= 1. A “condition” is characterized by three parameters: Q, the phase difference between left- and right-eye sine waves; m, the contrast of the higher-contrast sine wave; б, the fractional reduction in contrast of the lower-contrast sine wave. For every condition, there are four different displays: The higher-contrast sine wave can be either above the midline in the left eye (a1) or right eye (a2), or it can be below the midline in the left eye (a3) or right eye (a4) (examples of display types a1 and a3 are shown in Fig. 3 a and b).
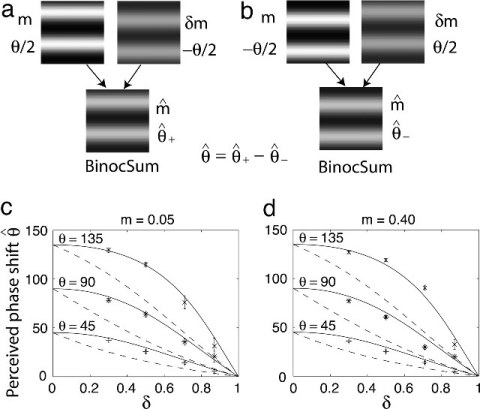
Fig. 3. Stimuli and results. (a) When two sine waves of different contrast (m and бm) and different phase (Q/2 and –Q/2) are presented to two eyes, a cyclopean sine wave with apparent contrast m and apparent phase Q is perceived. (b) Version of a reflected around the horizontal axis. (c and d) Perceived cyclopean phase shift Formula as a function of contrast ratio б for stimulus phase shifts Q of 45° (+), 90° (*), and 135° (X). The contrast m of the higher-contrast sine wave is 5% in c and 40% in d. The solid lines are the one-parameter fit of model 3 to the data; the dashed lines are parameter-free predictions of model 1 (linear summation).
For each of the four displays (a1, a2, a3, and a4) comprising a condition, the perceived location of the cyclopean sine wave
is determined by means of a psychophysical up–down tracking procedure. The perceived location of the cyclopean bar Q for a condition (Q, m, б) is given by
This measure of Q has the advantage of canceling slight position or eye biases should they occur. Q has the property that, when one eye is closed (б = 0), the location of cyclopean sine wave is identical to that of the monocular sine wave, so Q = 0. When two eyes have the same stimulus (б = 1), Q = 0.
The perceived phase shift Q measures how far a particular contrast ratio б pushes the cyclopean perception Q toward the maximum possible value Q. The perceived phase shift Q was measured for 48 conditions with values of m = {0.05, 0.10, 0.20, 0.40}, б = {0.3, 0.5, 0.71, 0.86}, and Q = {45, 90, 135} degrees. All 192 display types were interleaved in a mixed-list design (i.e., 192 up–down staircases were run concurrently). Three observers were tested.
Results. Sample results for m = 0.05 and m = 0.40 of one observer are shown in Fig. 3 c and d , each of which shows 12 (of 48) conditions. The ordinate indicates the perceived phase shift Q and the abscissa indicates the contrast ratio б. The dashed curves are predictions of the linear summation model (Fig. 1a):
Linear summation gives a poor fit to the results. That all of the data points are above the dashed curves means that the eye with the higher-contrast stimulus has a greater influence in binocular combination than is predicted from simply adding the two input images.
The solid lines fitted to the data are generated by model 3. Even the lowest-contrast stimuli in this experiment are sufficiently strong that the total contrast energy. Given the estimated parameters, neglecting the 1 in the numerator and denominator of Eq. 6 changes the prediction by <1% and simplifies it to yield Eq. 10
The advantage of Eq. 10 over Eq. 6 is that, together with Eqs. 7 and 8, it yields a simple expression for the perceived phase shift Q
By using Eq. 10 (the close approximation to model 3) to fit the data, only one free parameter у needs to be estimated for each observer: у = 1.18 for the observer whose data are shown in Fig. 3. Overall, the one-parameter version of model 3 accounts for 95% of the variance of all of the data (48 combination conditions X three observers).
Discussion
Disclaimer. The stimuli used to judge binocular combination in this experiment were 0.68 cpd. This relatively low spatial frequency was used because the accuracy of judging the phase of a sinewave grating decreases in inverse proportion to its frequency. We do not know to what extent the properties observed in the spatial frequency channel centered at 0.68 cpd apply to other spatial frequency channels. Also, although we investigated how different spatial frequencies exert gain control on the 0.68 cpd signal, we did not study how correlated signals in different spatial frequencies combine. However, within the spatial frequency band studied, the gain-control model has some interesting properties and makes some counterintuitive predictions that we consider below.
At High Contrast, the Model's Output only Depends on the Contrast Ratio. For superthreshold stimuli EL(IL) >> 1 and ER(IR) >> 1, the 1's in the numerator and denominator of Eq. 6 become insignificant, yielding
or
The model's output only depends on the ratio of input contrast energies, independent of input contrast energies themselves. In experiment 1, the contrast energies EL(IL) and ER(IR) were quite high and, indeed, the full, nonsimplified model predictions were virtually independent of the contrast (m) of the stronger sine wave, i.e., they depended only on the ratio of contrasts.
Contrast-Weighted Summation for High-Contrast Sinewave Gratings. Consider sinewave gratings, such as those in experiment 1. Let the contrast modulation amplitudes bmL and bmR of the gratings presented to the left and right eyes be sufficiently high that bmL > 1 and bmR > 1. Eq. 13 (see also Eq. 15) becomes
This simple contrast weighted summation not only describes the spatial location of the cyclopean grating in experiment 1 but also the perceived contrast of the cyclopean grating in a superthreshold, binocular, contrast matching task (5). The more general issue of predicting the perceived brightness (as well as the perceived location) of a cyclopean image is considered below.
Linear Brightness Summation at Low Contrast and for Ganzfelds. As the contrast energy, EL(IL) and ER(IR), of input images is reduced, the gain–control model asymptotically approaches arithmetic summation, i.e., model 1.
Model 3 reduces to model 1 (arithmetic stimulus summation) whenever there is negligible contrast energy for mutual inhibition. This is the case not only for near-threshold stimuli but also in Ganzfelds with quite intense stimuli. In a Ganzfeld, theentire visual field is covered with a uniform light intensity. A Ganzfeld has no contours, and therefore, zero contrast energy E. When the two eyes are presented with two identical Ganzfeld stimuli (6), binocular brightness increases monotonically with monocular brightness increasing from weak to strong. The perceived binocular brightness is simply the sum of the monocular brightnesses, as predicted by model 3.
Summation of Unequal Interocular Contrasts: Binocular Isocontrast Contours. In our binocular combination experiments, we measured only the phase, not the amplitude, of the cyclopean sine wave. To determine how well model 3 can predict amplitude as well as phase, we rely on an abundance of published data concerning the perceived brightnesses and contrasts of cyclopean images. Here we consider interocular sinewave stimuli of unequal contrast (as in our experiments). Let the stimuli to the left and right eyes, respectively, be IL = mL sin x and IR = mR sin x, which yield the corresponding contrast energies for gain control. Let m be the perceived contrast of the cyclopean sinusoidal grating when the above two sinusoidal gratings, IL and IR, are presented to two eyes. From Eq. 6, we have
Eq. 15 describes binocular isocontrast contours when two sinewave gratings of similar spatial frequencies but of different contrast are presented to two eyes. The isocontrast contours generated by Eq. 15 are quite similar to the empirically isocontrast contours observed by Legge and Rubin (5). Similar contours describe the empirically observed binocular isobrightness contours when two luminance disks, with or withoutconcentric circles, are presented to two eyes, e.g., Levelt (7, 8).
In Fechner's Paradox, one eye is presented a stimulus of moderate luminance, and the other is presented a zero-luminance stimulus. As the luminance of the zero-contrast stimulus is increased, cyclopean brightness decreases. Fechner's Paradox in binocular brightness combination occurs in ordinary stimuli such as discs but not in Ganzfelds (6). Fechner's Paradox also occurs in judgments of contrast matching in binocularly viewed sine waves (5). Model 3, which predicts simple summation for Ganzfelds (because they produce no interocular contrast energy for inhibition, E) also makes quite accurate predictions of Fechner's Paradox for sine waves (because of their large E).
Rivalry, Higher-Order Binocular Phenomena. Up to this point, we have dealt with “compatible” stimuli in the left and right eyes that can be binocularly combined: in our experiments, two parallel sine waves that differ in phase by at most 135°, in other experiments, disks of the same size but of different brightnesses, and so on. However, suppose the stimuli in the two eyes are incompatible, i.e., they cannot be interocularly combined, such as sine waves 180° out of phase (one is the negative of the other) or perpendicular sine waves. Model 3 makes a prediction of the relative strength of the left- and right-eye stimuli in a combination process except that, for incompatible stimuli, the combination process is not addition but a binary choice that admits only one or the other to further processing, i.e., rivalry. In the case of rivalry, model 3 is interpreted as making a prediction of the relative proportions of times that each eye's stimulus is dominant, i.e., admitted to further processing, as opposed to the present case, where model 3 determines the proportion of the cyclopean image that is determined by each eye. Dealing with incompatible binocular stimuli is inherently more complex than dealing with compatible stimuli and is beyond the scope of the present treatment.
Also beyond the scope of the present treatment are “higher-order” binocular interactions that involve global considerations, such as the perception of one part of a stimulus influencing how another part is perceived, top-down effects of attention, and similar instances where complex interpretations of the visual stimulus influence ocular dominance (e.g., ref. 9).
Discussion
Model 3 is a simple, robust, physiologically plausible model that accurately describes an early stage of binocular combination.
References
- Cogan, A. I. (1987) Vision Res. 27 , 2125–2139.
- Wilson, H. R. (2003) Proc. Natl. Acad. Sci. USA 100 , 14499–14503. Abstract/FREE Full Text
- Grossberg, S. & Kelly, F. (1999) Vision Res. 39 , 3796–3816.
- Yang, Y. & Blake, R. (1991) Vision Res. 31 , 1177–1189.
- Legge, G. E. & Rubin, G. S. (1981) Percept. Psychophys. 30 , 49–61
- Bolanowski, S. J. J R. (1987) Vision Res. 27 , 1943–1951.
- Levelt, W. J. M. (1965) On Binocular Rivalry (Institute for Perception RVOTNO, Soesterberg, The Netherlands).
- Levelt, W. J. M. (1965) Br. J. Psychol. 56 , 1–13.
- Blake, R. (2003) in The Visual Neurosciences, eds. Chalupa, L. M. & Warner, J. (MIT Press, Cambridge, MA).