
Abstract
Content
- Introduction
- 1. Border detection methods
- 1.1 Sobels method
- 1.2 Laplaces method
- 1.3 Roberts method
- 2. Volume calculation methods, based on image series
- 2.1 Determination of geometrical size of the object on perspective images
- 2.2 Calculation of geometric parameters on parallel projections
- 3. Clinical programs
- 3.1 System
Тонкий луч
- 3.2 Planing system
Nucletron
- 3.3 Planing system
Eclipse
from Varian - Conclusion
- References
Introduction
Computer technologies take up more areas of modern life, so it is not surprising that modern medicine is actively using the latest scientific developments and methods. So the more time technologies are developed, the more time we spend sitting behind the screen. Use of computers in medicine can greatly simplify doctors’ work, as well as improve the accuracy of diagnosis and treatment planning of patients improve.
Tumors are abnormal tissue growths consisting of qualitatively altered cells become atypical in concerning differentiation, growth pattern and other processes. There is benign and malignant tumors. Tumor treatment is performed by different methods depending on tumors type, localization, stage, patients’ age, etc. In today’s world more and more attention is paid to the use of radiotherapy for the treatment of malignancies.
Radiation therapy is a set of activities, which include not only treatment, but also pre‑calculation of treatment parameters. Successive stages of radiation therapy:
- MRI;
- treatment planning;
- simulation;
- basically treatment;
The most important stage of the treatment is the clinical planning. At this stage the volume and localization of tumors is calculated. Based on these data treatment plan is developed, the required exposure dose is set. In turn, the development of optimal treatment plan must correctly identify the geometric parameters of the neoplasm.
1. Border detection methods
Border detection is the main part in image processing and recognition. Edges are points of highly‑growth difference of brightness in images and so are one of the main characteristics of the image. Such points shows borders of objects in images. Information about edges allows to reduce the data amounts, keeping safety an important information about objects shape in the scene. Border detection is one of the most using technology in computer vision. Boundaries determining is the computation of two‑dimensional spatial gradient in the image, and identifies the regions corresponding to the edges. Thus there is a gradient Estimation of the modulus at each point of the half‑tone image.
Edge detection is the term in theory of image processing and computer vision, also partly from the objects searching and object selection. It is based on algorithms that set points of the digital image in which brightness changes sharply or there are other irregularities. Result of the allocation of borders is a set of related curves indicating the boundaries of objects, faces and impressions on the surface, as well as curves that represent reposition of surfaces. Objects are composed of numerous parts of different coloured layers. Brightness changes line is a connected set of pixels lying on the boundary between the two regions.
Lets look at some of the most popular methods of boundaries boundaries.
1.1 Sobels method
This method allows you to determine the image boundaries by superimposing of two rotational masks for each pixel. These masks can detect horizontal and vertical edges of objects in the image.
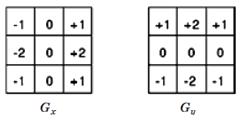
Figure 1.1 – Sobels masks
Separate imposition of these masks allows to calculate per pixel value of the vertical Gy and horizontal Gx gradients. The final value is determined by the formula 2.1.

Formula 1.1 – Sobels formula
1.2 Laplace method
To solve the problem of allocation of brightness differences we can apply higher order differential operators, such as Laplace operator (formula. 1.2)
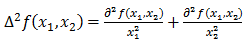
Formula 1.2 – Laplace operator
Discrete Laplace operator may be implemented as processing procedures of the linear image window 3x3.
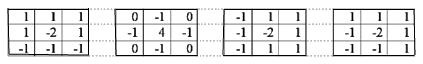
Figure 1.2 – Laplace masks
For the proper image filtering one mask is enough. Here the gradient value is directly calculated, not like an average after two times masks implementation. As a result, this method has an advantage in calculation difficulty, but the results are worse.
1.3 Roberts method
Roberts crossover operator is one of the earliest border selection algorithms in computer vision that computes sum of squared differences between diagonally adjacent pixels. This can be done by convolution image with two cores.
In other words, each pixel of the image is calculated by the formula:
tmp1 = absolute_value(input_image(x, y) − input_image(x+1,y+1))
tmp2 = absolute_value(input_image(x+1,y) − input_image(x, y+1))
output_image(x, y) = Sqrt(tmp12 + tmp22)
Such pixel conversion allows to show the derivation of image based on non‑zero diagonal. Combination of similar transformed images can be used as gradient from two higher pixels to two lower. Roberts operator is still used because of the high speed of calculations, but it is very noise‑sensitive. Lines calculated by Roberts filter are thinner than calculated by others. It is also knows as Roberts filter.
2. Volume calculation methods, based on image series
Calculation of object value is common task and already has a lot of different solutions in programming. In case with regular figure the value can be obtained using all‑known formulas. But in case of irregular form figure we do have a lot of complications.
There is a lot of methods for value calculation based on flat images of the object. The main difference between them is what projections do we use for size calculation.
Let us consider different ways to determine the geometric parameters of the object depending on the complex of object images.
2.1 Determination of geometrical size of the object on perspective images.
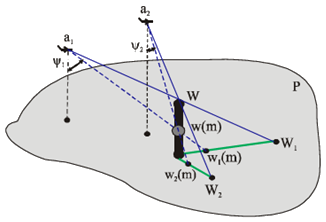
Figure 2.1 – perspective projection of W on the plane P
As we can see on the fig. 2.1, there are 2 images W1 and W2, get from points a1 and a2 accordingly. It is said, that we do know the location of the FA and the object. Then, based on contour analyse methods, we determine the conjugate points in projections W1 and W2, fixed contour of the projection and calculate the linear parameters of the object. After that we can build the 3D model of the object.
2.2 Calculation of geometric parameters on parallel projections.
Modern medical diagnostic equipment type MRI and CT make scans of patients and receive a number of parallel images of slices of the body.
the task of calculation of organs value is divided onto some parts. The main one is to calculate the cross‑sectional area of the organ or tumor. This task is very time‑consuming and resource‑intensive, because organs and tissues usually have irregular form. So, the only way to calculate their parameters is to use program integration. As obtained results will be in pixels, so we need to get metric characteristics of organs. For this purpose let’s use the advantages of DICOM type.
")
Picture 2.2 – Brain slices.
As we know, object volume is production of square of the figure on its’ high. So we can calculate organ (or tumor) value as its cross‑sectional area on the thickness of slices. Such method can’t exclude measurement errors, so we obtain some errors in calculations. But increasing the number of slices can minimize errors. Modern CT and MRI tomographs allows to make slices every millimeter.
3. Clinical programs
As noted earlier, DICOM is a medical
image format. Development and implementation of this type of files is done with the aim to
simplify the work of medical radiologists
Programs, often used in medical centres, are specified in common and are used for special purpose in medicine. As soon as it’s planned to design an oncology system, we are going to show here some specialised software for oncology hospitals. As an addition, such software has option for radiology treatment planning.
3.1 System Тонкий луч
System Тонкий луч
planning for external beam radiotherapy with 60Co source was developed in the early 90s and is oriented
on the technical possibilities of the time. In particular, it worked under the MS DOS operating system and had limited communication
with other software. Currently Тонкий луч
although in its capabilities satisfies a significant share of routine tasks
Planning on a single cross‑section of the patient is extremely poor in terms of the openness of the system, supporting information
flows and the effective use of the power of modern computing facilities and multi‑tasking operating systems. Unfortunately, still
been used in a number of national clinics due to the fact that there is no financial ability to purchase new equipment and software.
This system has now been obsolete.
3.2 Planing system Nucletron
Advantages of this planning system are:
- Simple in use.
- Relatively quick calculation of dose.
- Possibility to calculate every possible dose.
Disadvantages are:
- Work under MS DOS.
- Enter the cross section manually based on pattern that may not reflect the structure of the internal organs of the patient.
- Absence of the database.
- Calculation session time manually.
3.3 Planing system Eclipse
from Varian
Planing system Eclipse
from Varian is – comprehensive system that simplifies the complexity of modern radiotherapy, counting
dose distribution is not on the same cross‑section, and in the bulk medium by using multiple images. In Eclipse Physics
carefully create, select and check the best treatment plan for their patients.
Advanced algorithms in Eclipse quickly and accurately calculate the dose distribution for photons, electrons and protons. With a combination of modular algorithms and a flexible architecture of Eclipse, the doctor may choose an optimal algorithm for each individual treatment.
Based on the above, we see the following: cheap native planning systems are outdated and do not meet modern needs of physicians and foreign developments are very expensive and require ongoing funding and equipment upgrades. It should also be noted that even in the most advanced planning system allocation of the boundaries of the affected tissues is carried out manually.
Conclusion
Various methods of contouring objects are based on pixel‑operation, consistently apply various filtering masks for each image point. Further, the new values are used for calculating the pixel colour, and so the image consists of only the edges of objects. It should also be noted that these operations are performed on the greyscale images.
After results comparison Roberts method was chosen.
Analyse of medical software The applications considered are radiation therapy planning systems. Modern planning permit to build a three‑dimensional image, calculate the size of the affected tissues and the necessary treatment options. However, such systems are very expensive, which significantly reduces the number of users. Also, these systems do not support national languages, which could negatively affect the process of planning non‑standard treatment cases.
Fatherland system, unfortunately, are today already obsolete, but such planning systems are still in use on the territory of the former Soviet Union, as technical equipment of the local hospital does not allow to implement modern technically demanding system.
The main task of the master’s work will be the creation of an application that allows you to create three‑dimensional image of the body, excrete it affected part, calculate geometric and relative parameters of the affected part. For correct use of this application is necessary to develop project documentation. It is also required to make recommendations on the protection of the workplace medical physicist. Possible addition to master’s work is advanced research in various areas.
This master’s work is not completed yet. Completion date: December 2014. The full work and materials on the topic can be obtained from the author or her supervisor after this date.
References
- Анализ методов выделения краев на цифровых изображениях // Internet source – link: http://masters.donntu.ru.
- Н. А. Чернухин, Комбинированный метод детектирования границ на рентгенографических медицинских изображениях, использующий методику активных контуров/ Научный журнал КубГАУ, №88(04), 2013 года // Internet source – link:http://ej.kubagro.ru.
- И.О.Титов, Г.М.Емельянов, Выделение контуров изображения движущегося объекта/ Вестник Новгородского государственного университета №55, 2010 // Internet source – link: http://www.novsu.ru.
- На заметку: Оператор Кэнни // Internet source – link: http://nitkl.blogspot.com.
- Выделение краёв. Сегментация изображений.// Internet source – link: http://courses.graphicon.ru.
- Я. А. Фурман, Е. А. Попов, Р. В. Ерусланов Восстановление изображения 3d‑объекта по его перспективным проекциям на плоскую горизонтальную поверхность / 2010г..
- М. Г. Персова Зондирование становлением поля трехмерных сред и проблемы интерпретации / Сибирский журнал индустриальной математики апрель – июнь, 2009. Том XII, № 2(38).
- Eclipse | Planning Technology // Internet source – link: http://www.varian.com.
- 3DSlicer // Internet source – link: http://en.wikipedia.org.
- Oncentra External Beam // Internet source – link: http://www.nucletron.com.
- Алгоритм Робертса // Internet source – link: http://program.rin.ru.
- Linear Contrast Stretch of Grayscale Images // Internet source – link: http://www.codeproject.com.