
Abstract
Content
- Introduction
- 1. The tasks of technical diagnosis
- 2. The functions and parameters of diagnosis
- 3. Diagnosis methods
- 3.1 The organoleptic diagnosis method
- 3.2 The vibration diagnosis method
- 3.3 The acoustic diagnosis method
- 3.4 The thermal method
- 3.5 Diagnosis based on the analysis of wear products in the combustion products
- 3.6 The acoustic emission method
- 3.7 The radiographic method
- 3.8 The magnetic particle control method
- 3.9 The eddy current diagnosis method
- 3.10 The ultrasonic diagnosis method
- 3.11 The capillary diagnosis method
- 4. Diagnosis of electrical equimpents of electrical power stations and substations by means of infrared techniques in practice
- 5. Problems of technical diagnostics
- Conclusion
- References
Introduction
Diagnosis of electrical equipment occupies an increasingly important place in modern electric power industry of Ukraine and Russia. Depreciation of fixed assets of power industry for a long time has already passed for 50%. Currently, the industry has neither the financial nor the technical capabilities as soon as possible to replace equipment that has exhausted its regulatory resources. The annual growth of the park of electrical equipment with above norm lifetime considerably exceeds the growth of the newly introduced equipment, in view of the use of the system of preventive maintenance to maintain the necessary equipment availability becomes more difficult. To move to repair, depending on the actual state encourages the rapid development of means and methods of technical diagnosis.
In the electric power industry has ripened problem of creating a system of technical diagnosis that would solve the problem of the organization of repair of electrical equipment in accordance with its status. In addition, the need to improve the operational reliability of electrical equipment operating in the current environment, by identifying defects, prediction of their development, it is an urgent task [1].
As the foundation for constructing an effective diagnosis system should be applied such diagnostic methods, which have a relatively high informative, technical and regulatory provision. Along with the traditional methods of control over the last decade, we have been used modern high diagnostic methods that provide detection of defects of electrical equipment at an early stage of their development and to monitor sufficiently wide range of options.
1. The tasks of technical diagnosis
Currently, the modern domestic and foreign power plants, substations and electrical networks operated a significant number of worn out electrical equipment. For example, in the United States as of 1997 is around 65% of power transformers have worked more than 25 years, in Russia depreciation of fixed assets of power industry is around 50% [2,3]. As of the end of 2005, the average life of the of electrical equipment in Ukraine already more than half of project, which leads to a decrease in the reliability of its operation, increase the accident rate.
Existing in domestic electric power industry the system of preventive maintenance of electrical equipment [2,3] is not always justified, as it does not take into account its actual technical condition, and often require withdrawal from the work of the working equipment.
Therefore there is a need to develop new technologies and practices to ensure effective maintenance and repair of technical condition. This in turn determines the development of existing methods and control to obtain diagnostic information, development of mathematical models and algorithms to evaluate the technical condition of electrical equipment that form the basis of the expert system of decision making [2,4].
In general, the expert system technical condition assessment of electrical equipment determines the following: Is the equipment in good condition, does not require any intervention; whether extra attention from the staff or rapid control of equipment parameters; whether you want to perform additional measurements, tests and other preventive measures, and to disconnect without turning off; whether to conduct repairs, modernization, simplification modes or output of electrical work.
To evaluate the technical condition of electrical equipment can be use the automatic classifier constructed based on fuzzy algorithms and allows on the basis of the parameters of state include diagnosis object to one of the classes of a technical condition [4].
Condition of force electrical equipment is characterized by a large number of state parameters (attributes), the values of which can be obtained using standard measuring instruments or by additional tests, or running off the equipment. When a large number of parameters of the state, building a fuzzy knowledge base of expert system becomes difficult to achieve.
2. The functions and parameters of diagnosis
Diagnostics of technical condition of electrical equipment can be carried out by special devices, which are made direct measurements of the electrical parameters of the controlled objects with traditional methods and instruments for measuring of electrical equipment characteristics of the indirect, such as the surface temperature on the non-contact measurement of the heat which is based nondestructive testing – thermal imaging diagnostics, but processes diagnosis technical objects includes the following functions:
- evaluation of the technical state of the object;
- detection and determining place of localization of malfunctions;
- prediction of residual resource of the object;
- monitoring the technical condition of the object.
Under the diagnostic parameters understand representative parameters by which to judge the state of the object. There are direct and indirect diagnostic parameters. The first directly characterize the state of the object, and the second related to the direct dependence of the parameters of the functional [4].
Under the functional diagnostics object in the process of his work – in addition to separately consider the options – can also be used as an indication of the state of functional relations (functional dependencies) parameters.
3. Diagnosis methods
3.1 The organoleptic diagnosis method
The organoleptic diagnosis methods based on the use of human senses.
The visual inspection, temperature control and visualization of mechanical vibrations on the list of organoleptic methods of diagnosing and monitoring of the equipment. They are quite effective and do not require material costs, as in the role of a diagnostic instrument
in this case is the people.
The temperature control is an important aspect of the evaluation of the technical condition of the mechanical equipment. Up to 95% of all energy forms, create and send machines directly or partially converted into heat energy. The parameter is the temperature of the thermal diagnosis, reflecting the course of the working process and the development of a number of malfunctions.
The heating temperature machine frame as a diagnostic parameter has two special features: the appearance of certain types of fault causes an increase in body temperature mechanism; the inertia of the heating of metal parts, housings and bearings does not allow this option to determine the sudden failures and incipient damage. The technical operation of limiting temperature regulate the bearing housings, which should not exceed the ambient temperature by more than 40°C and not exceed 60-80°C. Some mechanisms have circulating lubricating system and cooling, the temperature difference estimated oil or water at the outlet and inlet. This allows you to control the thermal processes, the overall condition of the equipment, as well as its degree of deterioration. Normally, the temperature difference at the output and input should not exceed 5-10°C.
3.2 The vibration diagnosis method
The vibration diagnosis methods based on the analysis of vibration parameters of technical objects.
Vibration diagnostics – a method diagnosis of technical systems and equipment, based on the analysis of vibration parameters, or create working equipment or a secondary vibration caused by the structure of the object.
Vibration diagnostics, as well as other technical diagnosis methods, solves the problem troubleshooting and evaluate the technical condition of the object.
At vibration diagnostics usually investigated time signal or the spectrum of vibration of certain equipment. Also used cepstral analysis (cepstrum – an anagram spectrum).
At vibration diagnostics analyzes vibration velocity, vibrodisplacement, vibroacceleration [6].
Of the vibration sensors most commonly used accelerometers (vibration transducers acceleration) the piezoelectric sensors.
The greatest development of the method was in diagnosing rolling bearings. Also vibration method has been successfully used in vibration testing and diagnostic products wheel-gear units in railway transport.
Worthy of attention are vibroacoustic methods for finding gas leaks in hydraulic equipment. The essence of these methods is as follows. Liquid or gas, and throttling slot through gaps creates turbulence, accompanied by pressure fluctuations, and as a result, the spectrum of vibration and noise appear relevant harmonic frequencies. By analyzing the amplitude of these harmonics can be judged on the presence (absence) of a leaks [7].
Intensive development of the method in recent years due to the reduction in the cost of electronic computing resources and simplify the analysis of vibration signals [8].
Advantages of the method:
- method allows to find hidden defects;
- method usually requires no assembly and disassembly of the equipment;
- small diagnosis time;
- the ability to detect of malfunctions at the stage of their origin;
- reduction the expected risk of accidents in the operation of the equipment.
Disadvantages:
- specific requirements for the method of mounting the vibration sensor;
- the dependence of vibration parameters on many factors and the complexity of allocating the vibration signal caused by the presence of a malfunction, which requires a thorough application of correlation and regression analysis;
- the accuracy of the diagnosis in most cases depends on the number of smooth (as averaging) parameters such as the number of assessments SPM.
3.3 The acoustic diagnosis method
Of the sensor signals (PD) PD (electrical, electromagnetic, acoustic) got great use is acoustic. Acoustic diagnosis method based on the analysis of the parameters of the sound waves generated by the technical objects and their constituents.
Electrical sensors are able to give an approximate location of the signal source PD, based only on the comparison of the intensities of the signals at various points of the equipment (transformer). To localize the defect is usually used acoustic sensors that although they are much less sensitive, but, due to the relatively low speed of propagation of acoustic signals, allow a fairly accurate source localization signals inside the transformer. Acoustic sensors are substantially independent external interference in the substation. Measuring PD signals in real-world conditions while facing certain difficulties, but it is quite solvable problem. Currently, successfully tested on the power substation equipment of almost all classes of voltage and power the system СКИ-2. Equipment reliably detects signals from PD 50-500 pC levels even in the face of very strong interference of high intensity with an amplitude reaching 15 pC. Russia has mastered kit for determining the acoustic partial discharge on the basis of the acoustic receiver 5 LDA/S the company Intereng Messtechnik
. With his determined place partial discharges in transformers, circuit breakers, current and voltage transducers. Scores diagnosis can be obtained using the method of PD and the flaw detector Филин-6
.
3.4 The thermal method
The infrared thermography method. Loss of electric power for heating elements and of electrical equipment assemblies during operation dependent on the technical state. By thermal methods also include a method diagnosis based on the use of thermal imagers.
By measuring the infrared radiation due to the heating, it is possible to draw conclusions about the technical condition of electrical equipment. Invisible infrared thermal imager is converted into a visible signal by man. This method of remote, sensing, which allows to record temperature changes in the fraction of a degree. Therefore, his testimony are highly susceptible to interfering factors, such as the reflectivity of the measurement object, and the temperature of the environment as dust and humidity absorb infrared radiation, and others.
3.5 Diagnosis based on the analysis of wear products in the combustion products
We know that the destruction of parts of the running GCU caused by overheating, gas corrosion, abrasion, followed by removal of the GCU, along with the gas stream of tiny particles of metal. Start of destruction and his character can be determined by recording the presence of wear products and their composition. Hence, the reporting method is similar to the analysis of diagnostics of wear in the oil. The solution to this problem is based on the use of a pulsed laser source with a method for determining the concentration of gas in turbulent flow. It was shown experimentally that the method allows for instant (within 10-14 s) and simultaneous measurements of local concentrations in mixtures in polyatomic gases. Determination of the composition and concentration of wear performed in the composition analysis of samples of the combustion products drawn from the exhaust duct SBS. The disadvantage of this method is associated with its complexity and discrete control of technical condition. The prospect is it related to the fact that this method is very effective for diagnosing such an important site as the combustion chamber GCU, currently the least covered by the diagnosis.
3.6 The acoustic emission method
To control all kinds are widely used and the ranges of radiation. Acoustic emission is in the audio range. Known method of controlling the optical radiation using OL electro-optical flaw. It is based on the detection of spatial temporal distribution of brightness and definition of the nature of its defective insulators. For the same purposes with varying efficiency use of Radio and ultrasonic techniques, and control method of ultraviolet radiation using electron-optical flaw Филин
.
3.7 The radiographic method
Control is based on penetration of gamma and X-rays through materials, the method is widely used in non-destructive testing. Used to determine the internal defects in metal and machinery.
Using radiographic inspection methods switchgear for wear or defects, ABB has saved American customer 38 days of downtime, preventive maintenance required on 26-breakers, and the cost of this test was less than half the usual cost of this service. For example, when checking machines for voltage 35-145 kV conventional method requires two days, and radiographic inspection allows you to perform the job for two hours. If we take the circuit breaker for 550 kV, respectively, it will take five days and four hours. The main advantage is the ability to leave radiography sulfur hexafluoride in switchgear, not to pump it, as is the case in conventional test.
3.8 The magnetic particle control method
The magnetic particle method – one of the most popular, reliable and productive methods of non-destructive testing of surfaces of articles made of ferromagnetic materials in their production and operation.
MPC – one of the four classical methods of non-destructive testing, as well as one of the oldest NK methods, involving the use of equipment and materials for penetrant NK. The first experiments have described the phenomenon of magnetic scattering fields and explained their significance. Subsequently, attempts were made to find use for this phenomenon and put it in technical practice. In 1868, the Englishman Saxby applied compass to determine the defects in the gun barrel. In 1917, an American Hawk applied iron filings to detect cracks in steel parts.
The essence of the method: the magnetic flux in the defect-free part of the product does not change its direction; if it is on the way there are areas with low magnetic permeability, such as defects in the metal discontinuity (cracks, nonmetallic inclusions, etc.), part of the magnetic field lines coming out from the workpiece outwardly and enters back into it, with having local magnetic poles (N and S) and as a result, the magnetic field above a defect. Since the magnetic field is inhomogeneous over the defect, then the magnetic particles, trapped in this field, a force that tends to tighten the particles in place of the greatest concentration of magnetic field lines, that is, to the defect. The particles in the field of defect are magnetized and attracted to each other as magnetic dipoles, so that creating chain structures oriented along the magnetic field lines.
Magnetic particle method inspection is designed to detect subtle surface and subsurface discontinuities metal – defects that propagate deep into the product. Such defects can be cracked, hairline tears, flakes, lack of penetration, pores. The highest probability of defects is achieved in the case where the plane defect makes an angle of 90° with the direction of the magnetizing field (magnetic flux). With the reduction of this angle is reduced and the sensitivity at angles substantially less than 90° defects can not be detected.
3.9 The eddy current diagnosis method
The eddy current method is based on the analysis of the interaction of an external electromagnetic field and the electromagnetic field of the eddy currents induced by the exciting coil in an electrically conductive object control. The eddy current method allows to detection of defects such as discontinuities, onto the surface or lying in shallow water, as well as cracks, delamination, non-metallic inclusions, etc.
Eddy current testing is used for the analysis of conductive materials: metals, semiconductors, graphite, alloys, as well as neferromagnetiki. It is used primarily to search for cracks and stress corrosion cracking (SCC) in the gas and oil pipelines.
3.10 The ultrasonic diagnosis method
The ultrasonic control is also the most common method, this method can be divided into ultrasonic inspection (SPL) and ultrasonic thickness (UST). Ultrasonic testing is generally used to control the welds and base metal of the equipment to search for various defects such as subsurface or internal. Frequency used 2.5 or 5 MHz. Ultrasonic thickness used to measure the thickness of ferromagnetic material by means of ultrasonic waves. There is also a method of long-wavelength waves, but it operates in a limited range and has a wide application.
3.11 The capillary diagnosis method
The capillary control methods designed to detect surface defects in the objects of control. They are based on the capillary penetration of indicator liquids (penetrant) in the cavity material defects of the object of control and registration of test patterns generated.
The capillary method is based on an artificial increase in light and tsvetokontrastnosti defects relatively undamaged section. Penetrant inspection methods allow to detect with the naked eye thin surface cracks and other discontinuities of material resulting from the manufacture and use different objects.
4. Diagnosis of electrical equimpents of electrical power stations and substations by means of infrared techniques in practice
Evaluation of the actual state of force electrical equipment based on the results of diagnostic measurements – is very complicated and important task. A large part of the electrical equipment of the stations, substations, transmission and distribution of electricity is worn out, but continues to be used as its replacement requires large financial resources. In this regard, increasing every year the cost of due diligence and diagnostics.
In recent decades, a large widespread methods of controlling the parameters of power transformers under operating voltage. The methods of continuous monitoring and measured on-line
parameters of power transformers, which can be implemented in systems of monitoring, control include the value of tgδ Insulation bushings; measuring temperature of the upper layers of oil, load current, voltage pin bushings, oil pressure in the input, the moisture content of the oil, the content of dissolved gases in the oil by means of special sensors; level measurement vie Braz to assess the state of the pressing winding state of the magnetic circuit, the cooling system; monitoring of partial discharge (PD) in the insulation of inputs and coils, etc. The above methods have varying degrees of reliability and informativeness.
The thermal control method by means of infrared diagnostics and chromatographic analysis of gases dissolved in transformer oil (CHAGD) performed in accordance with the documents The scope and standards of electrical equipment tests
(SSEET), can detect a number of different defects in the high-voltage of electrical equipment (EE). About thermal imaging and its application to monitor the status of electrical equipment is known for several decades [11,12]. Тhe thermal imaging control is one of the main directions of development of high-performance technical diagnosis, which provides the ability to control the thermal state of the equipment and facilities without taking them out of work, identification of defects at an early stage of development, reducing the cost of technical inspection by predicting the timing and volume of repair work [13]. Thermal imaging control is carried out to determine the thermal state of the disconnectors, current transformers (CTs) and voltage (VT), surge arresters and surge arresters (SA), coupling capacitors, oil and air circuit breakers, busbar distribution devices (DD), the quality of the soldering of the stator windings of turbogenerators for repair works of high voltage inputs of power transformers, cooling systems of transformers, motors, generators, etc. Work is also control of chimneys and flue pipes in thermal power plants, finding places suction of cold air, etc. In the power Мамараэнерго
thermal control was carried out by means of infrared techniques such as INFRAMETRIKS-740
and Иртис
. In [13] discussed issues the use of thermal imaging detectors for the detection of faulty rations connecting rod heads of the stator winding of turbogenerators (TG) during the operation. This section deals with the use of thermal imaging detectors as a means of quality control of solder connecting rod heads stator windings TG using brazing at their repair. Thermal imaging control is carried out at the open end winding of the stator and rotor derived from the pre-heating of the DC power source (eg, backup exciter) current value of the order of 1000 A. In this case, a prerequisite for the effectiveness of the survey rod heads of the stator winding is the presence of excess temperature of the winding of the generator over temperature Environmental turbine shop.
Should be noted the following important point: to enable comparison of the results of measurements of the excess temperature T, TG performed on various types and capacities necessary to satisfy the requirements for the same current density in the heated coil. However, in the cases examined in the article TG repair this parameter is not monitored. In further repairs TG is supposed to do. In addition to thermal control, and there used to control hydraulic generators rations (hundreds of heads) eddy current method, but in this article it is not considered.
The maximum difference between the value of the DC resistance between the branches of the stator winding TG should not exceed 5%, and the deviation from the nominal value of not more than 2% [11]. Turbogenerator TG-6 Togliatti TPS of TVF-60-2, (year 1967 overhaul of a complete re-winding 1991) was in a long-term reserve. The results of measuring the DC resistance of the stator windings have shown that the maximum difference ΔRmax mezhduvetvyami was 6.8% (between the branches A1 and A2 phase A). Therefore, ΔRmax between the branches A1 and A2 Phase A SSEET exceeds the allowable level of 5%. Thermal imaging survey of the stator end windings of 17.03.2000 showed an increased heating rations places in seven points with excess temperature ΔT in the range from 4.1 to 6.6°C in comparison with the neighboring cold
(by its control) points (Fig. 1, 2). Of the seven points two points fall on a branch A2 of phase A, which has a higher ohmic resistance ΔRmax = 6,8% (between branches) (Fig. 1).
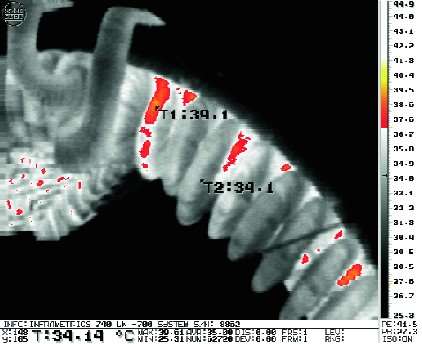
Figure 1 – The thermogram 17.03.2000, the generator 6 GT TPS. The view from the pathogen in the area 1 hour (up to 1 second resoldering), ΔT = 5C (Rmax = 6,8% between the branches A1 and A2 of phase A)
Based on these results held soldering rods branch A2 of phase A stator winding TG at the points specified in Fig. 1 and Fig. 2. ΔRmax between the branches A1 and A2 of phase A was 5.07%. After 1st resoldering decreased ohmic resistance ΔR for phase A by 1.8%. ΔRmax between the branches A1 and A2 of phase A is still higher than the permissible level SSEET 5%.
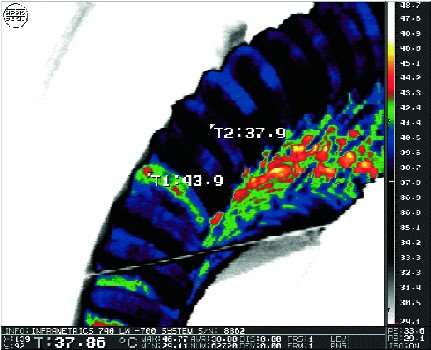
Figure 2 – The thermogram 17.03.2000, the generator 6 GT TPS. The view from the turbine near the 11 hours (until the 1st resoldering), ΔT = 6°C (Rmax = 6,8% between the branches A1 and A2 of phase A)
Repeated thermal imaging inspection of 30.03.2000 showed an increased heating of the two heads in the branch A2, which has a maximum deviation ΔRmax. Excess temperature ΔT near these two points was 5 to 7.6°C (Fig. 3, 4). That is, it was found that the thermal state of the head branches A2 in Fig. 3 (1 st soldering in Fig. 1), and thus the quality of its soldering deteriorated.
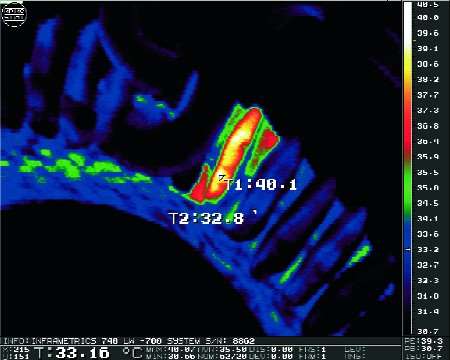
Figure 3 – The thermogram 30.03.2000, the generator 6 GT TPS. The view from the pathogen in the area of 1 hour (after the 1st resoldering), ΔT = 7,6°C ( ΔRmax = 5,07% between the branches A1 and A2 of phase A)
Therefore, 03.04.2000 was held resoldering two connecting branch heads in the A2 of phase A (see. Fig. 3, 4). Detected defect soldering head branch A2 (see. Fig. 3). Next ΔRmax between the branches A1 and A2 decreased and amounted to 4.4%, which corresponds to the acceptable standards of SSEET [11].
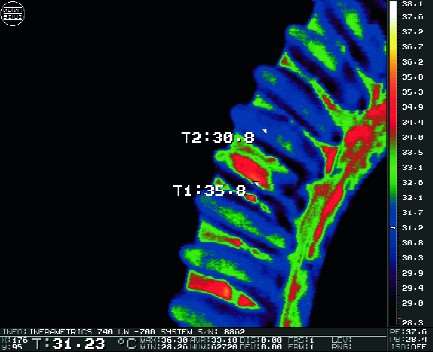
Figure 4 – The thermogram 30.03.2000, the generator 6 GT TPS. The view from the turbine in the region of 10 hours (after 1 th resoldering), ΔT = 5°C ( ΔRmax = 5,07% between the branches A1 and A2 of phase A)
The turbogenerator TG-4 TPS VAZ of TVF-120-2 (1970 year) is disconnected from the network effect of the transverse differential protection generator. The reason for protection operation was a violation of the soldering connection head branch C2 C phase stator winding (broken leg). Previous measurement of the DC resistance of the stator windings has shown that the maximum difference ΔRmax between the branches is 3.49%. The maximum deviation from the factory data was 2.2% on a branch C2. After resoldering the stator winding of 03.03.2000 was held thermal imaging survey of the quality of rations rod heads of the stator winding. The measurement results indicated an increased heating of seats ration for branch locations with C2 ΔT in the range from 3.6 to 3.9°C (Fig. 5, 6). After resoldering the maximum difference ΔRmax between the branches by 3.1%, from the factory data – 1.8% on the branch C1, corresponding to valid regulations on SSEET [11]. As a result of thermal imaging inspection of TG 6 TPS, TG-4 TPS VAZ and TG-2 Syzran TPS plotted the differences in maximum DC resistance of stator windings ΔRmax (between branches in%) on the value of the excess temperature ΔT (Fig. 7). Fig. 7 also highlighted the threshold limit of 5% for rejection ΔRmax of SSEET. Consideration of this dependence ΔRmax from ΔT led to the conclusion about the magnitude of the threshold value ΔT = 4-5°C, above which there may be a defect in the solder connecting rod heads of the stator winding of turbo-generators (TG) during ekspluatatsii.Odnako this schedule is approximate and in need of further refinement as experience thermal control and statistics measurements. The threshold criterion ΔT = 4-5°C is not final and will be updated.
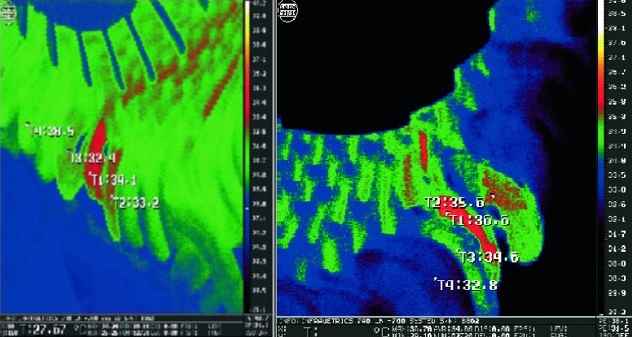
Figure 5, 6 – The thermograms 03.03.2000 of generator TG-4 TPS of VAZ. The front part of the part of the pathogen T = 3,6-3,9°C ( ΔRmax = 3,1% between the branches)
The turbogenerator TG2-25-2 Syzran TPS (1956 year) surveyed during the overhaul using thermal control in the open end winding of the stator and rotor derived from the pre-heating of the backup exciter direct current of the order of 600 A. In the course of a complete overhaul was carried out rewind of the stator winding of the turbogenerator; soldering defective connecting rod heads was carried out using a zirconium solder brand PMFOTsr 6-4-0,03.
Figure 7 – The dependence the maximum difference of DC resistance of stator windings ΔRmax (between the branches, in%) on the value of the excess temperature T (in comparison with the neighboring cold
(by its control) points. The view from the pathogen, TG TPS VAZ, STPS)(animation: 6 frames, 8 cycles of repating, 351 kilobytes)
In the primary thermal imaging survey of 27.10.2004 on the thermogram from the pathogen detected temperature rise of defective rod heads (points №№ 1-7, 10) of the temperature surrounding cold
points ΔT = from 3.1°C to 6.2°C when the difference value of the ohmic resistance ΔRmax = 15% between the phases, which significantly exceeds the rate specified in SSEET (Fig. 8). After a series of successive resolderings defective rod heads of the stator winding of the turbogenerator 27.10, 28.10 and 29.10.2004, the difference value of the ohmic resistance ΔRomich. between the first phase decreased with ΔRmax = 15% to 7.6% and further to 4.2%.
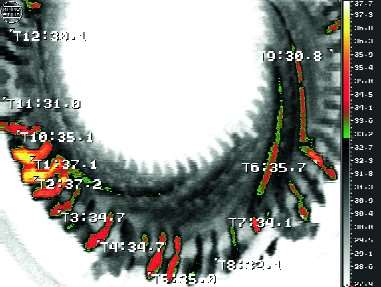
Figure 8 –The thermogram 27.10.04 turbogenerator type TG2-25-2 Syzran TPS, 1956 year. The view from the exciter, defective soldering rod heads –point number 1, № 2, № 3, № 4, № 5, № 6, № 7, №10 ( ΔT from 3.1°C to 6.2°C, ΔRomich. = 15%)
The electrical arrangement of the phases in the stator winding of the turbogenerator (view from the originator) is shown in Fig. 9.
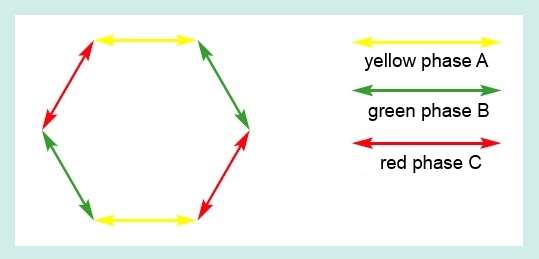
Figure 9 – The arrangement of phases in the stator winding
The thermal imaging survey 29.10.2004, after the next resoldering showed that the thermal scene, as seen from the pathogen, the number of defective rod heads ration decreased from 8 to 2 – point number 1, № 5 and ΔT ranged from 3.3°C to 5.5°C at ΔRomich. = 3.2% (Fig. 10). This demonstrates the effectiveness of the thermal quality control soldering connecting rod heads turbogenerators stator windings as a tool for assessing the quality of a consistent solders [14-16].
The thermal imaging can detect emergency of electrical equipment technical defects (EO) units with high heat and great temperature changes as compared to the ambient temperature (the maximum in this article ΔT = 116°C). Besides emergency, during thermal imaging survey found heatings bolting bus and line disconnectors which can be eliminated as far as possible outages.
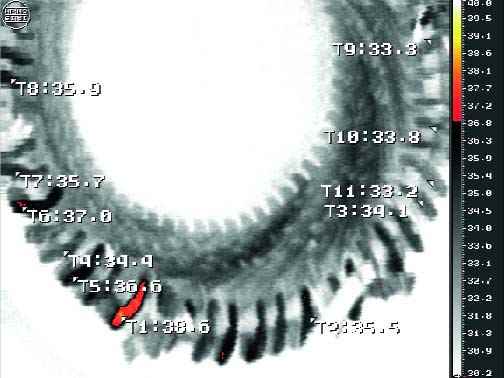
Figure 10 – The thermogram 29.10.04 turbogenerator type TG2-25-2 Syzran TPS, 1956 year. The view from the exciter, defective soldering rod heads – point number 1, № 5 ( ΔT from 3.3 to 5°C, ΔRomich. = 3.2%)
On Fig. 11 shows thermogram support insulator isolator 110 kV substation Novospasskaya-1
. Estimated cause of heat – moistening the inner surface of the porcelain, the increase of the leakage current along the inner surface ( ΔT = 1,4°C). On Fig. 12 – heating bolting hardware clip disconnectors 220 kV line in the direction of Clearance 2
substation Tomylovskaya
(sponge knife disconnect switch, phase, B
( ΔT = 48°C)). On Fig. 13 – heating bolting flexible communication bus isolator 110 kV oil circuit breaker side substation Chapaevskaya
(phase C
( ΔT = 116°C)).
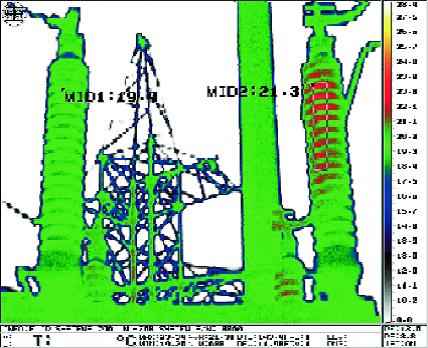
Figure 11 – Support insulator isolator SR 110 kV substation Novospasskaya-1
in the direction of Latvia. Phase A
. Presumably moistening the inner surface of the porcelain, the increase of the leakage current on the inner surface ( ΔT = 1,4°C)
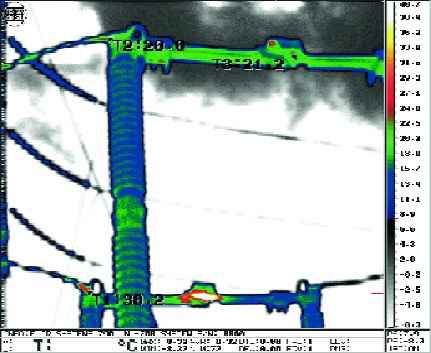
Figure 12 – LR-220 kV transmission line Clearance 2
substation Tomylovskaya
. Heating bolting hardware isolator clamp toward power lines. Sponges knife disconnect switch, phase B
( ΔT = 48°C)
Defects bolting disconnectors are not the only detectable thermal imagers. It is also possible the identification of local heating on the walls of the high-voltage oil-filled tank of EO associated with defects in the CT windings embedded or bad contacts within the oil switch, are hidden layer of oil and it is difficult to interpret. Fig. 14 is clearly visible heating phase A
built-in current transformer 110 kV ( ΔT = 5,1°C) substation ZIM 110/35/6 kV
. Presumably there are two possible reasons: raskorachivanie secondary terminals or TT circuit of coil winding TT. Fig. 15 shows a local heating of the oil tank on the wall switch VM-35 kV T1T
type MCP-35 Substation M. Ishutkino 35/10 kV
phase A
( ΔT = 3,7°C), which may be associated with a poor contact in the flexible connection to the conductor pins or contact group (socket arcing devices) [14-16].
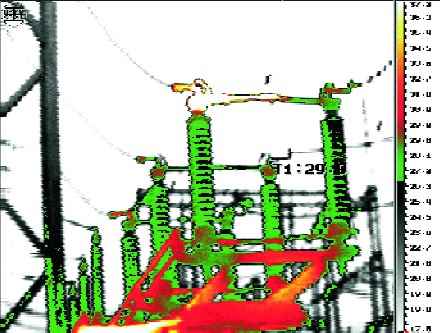
Figure 13 – SR-1-110 kV line civil
substation Chapaevskaya
. Heating bolting flexible connection to the side CF, phase C
( ΔT = 116°C)
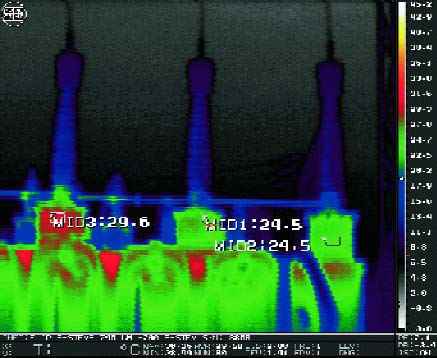
Figure 14 – Substation ZIM 110/35/6 kV
S1T transformer. Heating phase A
built-in current transformer 110 ( ΔT = 5,1°C)
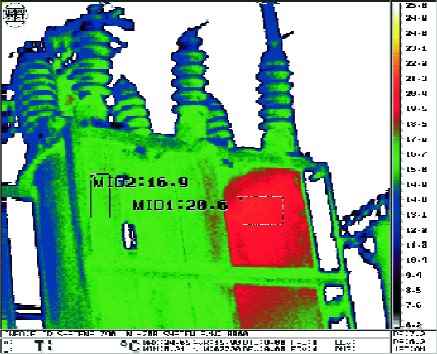
Figure 15 – Substation M. Ishutkino 35/10 kV
VM-35 kV T1T
type MCP-35. Local heating of the oil tank on the side of the switch, the phase A
. ( ΔT = 3,7°C)
5. Problems of technical diagnostics
The common problem of technical diagnosis is to achieve adequately assess the true state of the object recognition and classification of this state (normal or abnormal).
During the technical diagnosis to confirm the normal state of the object identified two main objectives:
- provide obtaining reliable information;
- provide reasonable promptness information.
When conducting technical diagnosis to detect anomalies identified two main problems:
- the probability of missing malfunction;
- the probability of a
false alarm
, ie the probability of false alarm on the availability malfunction.
The higher the probability of a false alarm
, the less chance of missing malfunction, and vice versa. The objective technical diagnostics of malfunctions is to find the golden mean
between the two problems.
Conclusion
Diagnostics of technical condition of electrical equipment can be carried out by special devices, which are made direct measurements of the electrical parameters of the controlled objects with traditional methods and instruments for measuring electrical characteristics of indirect, for example, the surface temperature on the non-contact measurement of the heat which is based nondestructive testing – thermal imaging diagnostics. The method allows for high-performance non-contact control of electrical equipment during operation without de-energizing the object and identify many defects at an early stage of their development, preventing the occurrence of accidents and emergency power systems.
The developed technique now being successfully applied in the field surveys, more than 50 facilities in practice.
Thermal imaging control has become an important tool for monitoring by the various electrical power system equipment: current and voltage transformers, disconnectors, surge arresters valve, high-voltage inputs, power transformers, oil circuit breakers, the quality of the soldering of the stator windings of turbogenerators in the repair of electric motors, chimneys and flues and others.
The problem of ensuring the quality of technology used soldering connection heads stator windings TG during the repair work today quite relevant. The need to verify the quality of soldering with a serial thermal control and measure the DC resistance of the stator windings TG.
For an objective definition of a technical condition of the equipment electrical systems are encouraged to use diagnostic software and information system that enables the collection and processing of primary information on the working electrical equipment with modern, high-performance diagnostic tools, issuing results of the processing of this information in a convenient form, the transfer of this information to the archive; appeal to the reference data set; initial diagnosis; a decision on further diagnostic operations. The diagnostic system includes lists of controlled units of various types of electrical, detected defects, control methods and parameters that characterize the operational state. Noted metrological support, the required level of automation and interoperability of measuring devices on the PC with the convenience and clarity of output.
The diagnostic system showed high efficiency in solving problems of early detection of defects in high-voltage equipment; forecasting the development of defects, assess their danger; determine the amount of repair work; optimization of repair and maintenance of equipment.
*When writing this abstract master's work is not yet complete. The full text of work and materials on the topic can be obtained from the author or his supervisor in January 2016.
References
- Косолапов А.Б. Система технической диагностики электротехнических комплексов // Успехи современного естествознания. – 2005. – № 2
- Алексеев Б.Л. Контроль состояния крупных силовых трансформаторов. – М.: Издательство НЦ ЭНАС, 2002. – 216с.
- Назарычев А.Н. Основные принципы системы технического обслуживания и ремонта электрооборудования по техническому состоянию // Надежность либерализованых систем энергетики / Под ред. Н.И. Воропая, А.Д. Тевяшева. – Новосибирск: Наука, 2004. – с.173-189.
- Структура экспертно-диагностической и информационной системы оценки состояния высоковольтного оборудования /Давиденко И.В., Голубев В.П., Комаров В.И., Осотов В.Н. // Электрические станции. 1997. №6. – с.25-27.
- Ротштейн А.П. Медицинская диагностика на нечеткой логике. – Винница: Континент-ПРИМ, 1996. – 132с.
- Пархоменко П. П. О технической диагностике. М: Знание, 1969 – 90 с.
- Приборы и системы для измерения вибрации шума и удара. Справ. в 2 кн. под ред. В.В. Клюева. М: машиностроение, 1978 – 844 с.
- Вибрации в технике. Т. 5. Ред. совет: В. Н. Челомей и др. М: Машиностроение, 1981 – 496 с.
- Технические средства диагностирования: Справочник / В.В.Клюев, П.П.Пархоменко, В.Е.Абрамчук и др.; под общ. Ред. В.В.Клюева. – М.: Машиностроение, 1989. – 672 с.
- Костюков А. В., Костюков В. Н. Повышение операционной эффективности предприятий на основе мониторинга в реальном времени. – М.: Машиностроение, 2009. – 192 с.
- Обьeм и нормы испытаний электрооборудования РД 34.45-51.300 – 97 с.
- Поляков В.С. Применение тепловизионных приемников для выявления дефектов высоковольтного оборудования. – Л.: 1990.
- Бажанов С.А. Инфракрасная диагностика электрооборудования распределительных устройств. ИТФ
Энергопрогресс
, Приложение к журналуЭнергетик
. – М.: 2000. - Григорьев А.В., Осотов В.Н. О совершенствовании и расширении методов контроля теплового состояния турбогенераторов. – Электpические станции, 1999, № 11.
- Хренников А.Ю., Еганов А.Ф., Смолин А.Ю., Щербаков В.В., Языков С.А. Тепловизионный контроль генераторов и импульсное дефектографирование силовых трансформаторов. – Электрические станции, № 8, 2001.
- Хренников А.Ю., Петров А.С., Цыгикало Г.В., ЩербаковтВ.В., Языков С.А. Cистемы мониторинга и опыт диагностики состояния электротехнического оборудования в ОАО
САМАРАЭНЕРГО
. – ЭЛЕКТРО. Электротехника, электроэнергетика.