 |
|||
|
Source - http://pslc.ws/macrog/level5.htm Differential scanning calorimetry is a technique we use to study what happens to polymers when they're heated. We use it to study what we call the thermal transitions of a polymer. And what are thermal transitions? They're the changes that take place in a polymer when you heat it. The melting of a crystalline polymer is one example. The glass transition is also a thermal transition. So how do we study what happens to a polymer when we heat it? The first step would be to heat it, obviously. And that's what we do in differential scanning calorimetry, or DSC for short. We heat our polymer in a device that looks something like this:
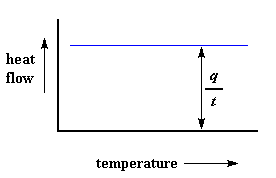
It's pretty simple, really. There are two pans. In one pan, the sample pan, you put your polymer sample. The other one is the reference pan. You leave it empty. Each pan sits on top of a heater. Then you tell the nifty computer to turn on the heaters. So the computer turns on the heaters, and tells it to heat the two pans at a specific rate, usually something like 10 o C per minute. The computer makes absolutely sure that the heating the rate stays exactly the same throughout the experiment. But more importantly, it makes sure that the two separate pans, with their two separate heaters, heat at the same rate as each other. Huh? Why wouldn't they heat at the same rate? The simple reason is that the two pans are different. One has polymer in it, and one doesn't. The polymer sample means there is extra material in the sample pan. Having extra material means that it will take more heat to keep the temperature of the sample pan increasing at the same rate as the reference pan. So the heater underneath the sample pan has to work harder than the heater underneath the reference pan. It has to put out more heat. By measuring just how much more heat it has to put out is what we measure in a DSC experiment. Specifically what we do is this: We make a plot as the temperature increases. On the x -axis we plot the temperature. On the y -axis we plot difference in heat output of the two heaters at a given temperature. Heat Capacity We can learn a lot from this plot. Let's imagine we're heating a polymer. When we start heating our two pans, the computer will plot the difference in heat output of the two heaters against temperature. That is to say, we're plotting the heat absorbed by the polymer against temperature. The plot will look something like this at first.
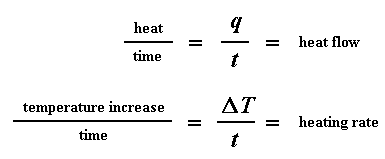
The heat flow at a given temperature can tell us something. The heat flow is going to be shown in units of heat, q supplied per unit time, t . The heating rate is temperature increase T per unit time, t . Got it?
Let's say now that we divide the heat flow q/t by the heating rate T/t . We end up with heat supplied, divided by the temperature increase.
Remember from the glass transition page that when you put a certain amount of heat into something, its temperature will go up by a certain amount, and the amount of heat it takes to get a certain temperature increase is called the heat capacity , or C p . We get the heat capacity by dividing the heat supplied by the resulting temperature increase. And that's just what we've done in that equation up there. We've figured up the heat capacity from the DSC plot. The Glass Transition Temperature Of course, we can learn a lot more than just a polymer's heat capacity with DSC. Let's see what happens when we heat the polymer a little more. After a certain temperature, our plot will shift upward suddenly, like this:
This means we're now getting more heat flow. This means we've also got an increase in the heat capacity of our polymer. This happens because the polymer has just gone through the glass transition. And as you learned on the glass transition page, polymers have a higher heat capacity above the glass transition temperature than they do below it. Because of this change in heat capacity that occurs at the glass transition, we can use DSC to measure a polymer's glass transition temperature. You may notice that the change doesn't occur suddenly, but takes place over a temperature range. This makes picking one discreet T g kind of tricky, but we usually just take the middle of the incline to be the T g. Crystallization But wait there is more, so much more. Above the glass transition, the polymers have a lot of mobility. They wiggle and squirm, and never stay in one position for very long. They're kind of like passengers trying to get comfortable in airline seats, and never quite succeeding, because they can move around more. When they reach the right temperature, they will have gained enough energy to move into very ordered arrangements, which we call crystals, of course. When polymers fall into these crystalline arrangements, they give off heat. When this heat is dumped out, it makes the little computer-controlled heater under the sample pan really happy. It's happy because it doesn't have to put out much heat to keep the temperature of the sample pan rising. You can see this drop in the heat flow as a big dip in the plot of heat flow versus temperature:
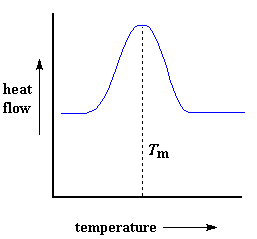
This dip tells us a lot of things. The temperature at the lowest point of the dip is usually considered to be the polymer's crystallization temperature, or T c . Also, we can measure the area of the dip, and that will tell us the latent energy of crystallization for the polymer. But most importantly, this dip tells us that the polymer can in fact crystallize. If you analyzed a 100% amorphous polymer, like atactic polystyrene , you wouldn't get one of these dips, because such materials don't crystallize. Also, because the polymer gives off heat when it crystallizes, we call crystallization an exothermic transition. Melting Heat may allow crystals to form in a polymer, but too much of it can be their undoing. If we keep heating our polymer past its T c , eventually we'll reach another thermal transition, one called melting. When we reach the polymer's melting temperature, or T m , those polymer crystals begin to fall apart, that is they melt. The chains come out of their ordered arrangements, and begin to move around freely. And in case you were wondering, we can spot this happening on a DSC plot. Remember that heat that the polymer gave off when it crystallized? Well when we reach the T m , it's payback time. There is a latent heat of melting as well as a latent heat of crystallization. When the polymer crystals melt, they must absorb heat in order to do so. Remember melting is a first order transition. This means that when you reach the melting temperature, the polymer's temperature won't rise until all the crystals have melted. This means that the little heater under the sample pan is going to have to put a lot of heat into the polymer in order to both melt the crystals and keep the temperature rising at the same rate as that of the reference pan. This extra heat flow during melting shows up as a big peak on our DSC plot, like this:
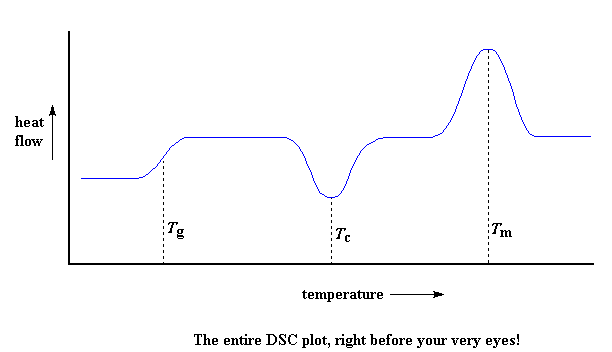
We can measure the latent heat of melting by measuring the area of this peak. And of course, we usually take the temperature at the top of the peak to be the polymer's melting temperature, T m . Because we have to add energy to the polymer to make it melt, we call melting an endothermic transition. Putting It All Together So let's review now: we saw a step in the plot when the polymer was heated past its glass transition temperature. Then we saw a big dip when the polymer reached its crystallization temperature. Then finally we saw a big peak when the polymer reached its melting temperature. To put them all together, a whole plot will often look something like this:
Of course, not everything you see here will be on every DSC plot. The crystallization dip and the melting peak will only show up for polymers that can form crystals . Completely amorphous polymers won't show any crystallization, or any melting either. But polymers with both crystalline and amorphous domains, will show all the features you see above. If you look at the DSC plot you can see a big difference between the glass transition and the other two thermal transitions, crystallization and melting. For the glass transition, there is no dip, and there's no peak, either. This is because there is no latent heat given off, or absorbed, by the polymer during the glass transition. Both melting and crystallization involve giving off or absorbing heat. The only thing we do see at the glass transition temperature is a change in the heat capacity of the polymer. Because there is a change in heat capacity, but there is no latent heat involved with the glass transition, we call the glass transition a second order transition . Transitions like melting and crystallization, which do have latent heats, are called first order transitions . How much crystallinity? DSC can also tell us how much of a polymer is crystalline and how much is amorphous. If you read the page dealing with polymer crystallinity , you know that many polymers contain both amorphous and crystalline material. But how much of each? DSC can tell us. If we know the latent heat of melting, ? H m , we can figure out the answer. The first thing we have to do is measure the area of that big peak we have for the melting of the polymer. Now our plot is a plot of heat flow per gram of material, versus temperature. Heat flow is heat given off per second, so the area of the peak is given is units of heat x temperature x time -1 x mass -1 . We usually would put this in units such as joules x kelvins x (seconds) -1 x (grams) -1 :
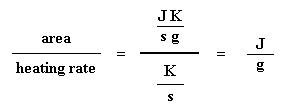
Got that? Don't worry. It gets simpler. We usually divide the area by the heating rate of our dsc experiment. The heating rate is in units of K/s. So the expression becomes simpler:
Now we have a number of joules per gram. But because we know the mass of the sample, we can make it simpler. We just multiply this by the mass of the sample:
Now we just calculated the total heat given off when the polymer melted. Neat, huh? Now if we do the same calculation for our dip that we got on the DSC plot for the crystallization of the polymer, we can get the total heat absorbed during the crystallization. We'll call the heat total heat given off during melting H m, total , and we'll call the heat of the crystallization H c, total . Now we're going to subtract the two:
Why did we just do that? And what does that number H ' mean? H ' is the heat given off by that part of the polymer sample which was already in the crystalline state before we heated the polymer above the T c . We want to know how much of the polymer was crystalline before we induced more of it to become crystalline. That's why we subtract the heat given off at crystallization. Is everyone following me? Now with our magic number H ' we can figure up the percent crystallinity. We're going to divide it by the specific heat of melting, H c * . The specific heat of melting? That's the amount of heat given off by a certain amount, usually one gram, of a polymer. H ' is in joules, and the specific heat of melting is usually given in joules per gram, so we're going to get an answer in grams, which we'll call m c .
This is the total amount of grams of polymer that were crystalline below the T c . Now if we divide this number by the weight of our sample, m total , we get the fraction of the sample that was crystalline, and then of course, the percent crystallinity:
And that's how we use DSC to get percent crystallinity. Copyright © 2005 by The University of Southern Mississippi [ВВЕРХ] [БИБЛИОТЕКА] [ГЛАВНАЯ] [ПОРТАЛ МАГИСТРОВ ДОННТУ] [ПОРТАЛ ДОННТУ] |
||

