|

|

|
Golban AlexeyMaster's dissertation theme:
Development and research of algorithms of computer trading systems adaptation to a market situation |
Resume
|
Biography
|
Library
|
Links
|
Research report
|
About preference
|

| Work actuality | Work purpose and tasks | Description of own researches | Literature |
Work actuality2008 is a major point in economic history of Ukraine. On May, 16th 2008 Ukraine officially became a member of the World Trade Organization (WTO). Membership in this organization gives an opportunity to increase the degree of presence in foreign markets. But for this Ukraine needs to adjust its economic system to international standards. One of the problems Ukraine has to cope with is insufficient development of stock-trading system. In countries of WTO over 85% of export-import transactions go through stock markets. Our state cannot brag of competent traders. As a result, state and private enterprises enter into direct contracts with foreign manufacturers and suppliers under overcharge. Bringing up successful traders is a long and complex process that should be based on qualitative theoretical studies and practical training. It is necessary to emphasize that the level of theoretical studies is very low today because of lack of qualitative literature. Not a single book available in book shops gives a clear understanding of how to choose technical indicator for certain market situations, how to combine indicators in one trading system, how to form system trade signals on the basis of several indicators signals. It is also important to understand that market situation continuously changes. Those decisions giving profit today may become inefficient tomorrow. This is why development of adaptive algorithms for trading systems is the main direction of scientific researches in the field of technical analysis today. Actuality of master’s dissertation theme is determined by the absence of effective adaptive algorithms and the necessity to develop methods decreasing trader’s risks. Work purpose and tasksThe purpose of dissertation researches is the development of effective algorithms of trading systems adaptation to a market situation. Next tasks should be carried out:
Description of own researchesThe main idea of researches is to define periods of ineffective system functioning. For this trading system equity curve is analyzed as a function of number of trades. This allows to use mathematical methods of function analysis and state:
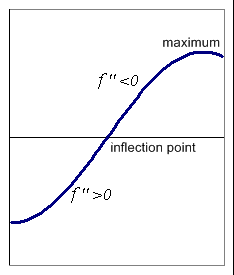
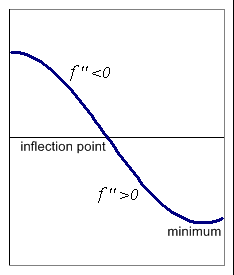
The only problem is that we can identify maximum and minimum only after passing them. But in this case they become useless for control in the future. For «forward» control it is offered to find inflection points of equity curve. Equity curve is a broken line as profitable and unprofitable transactions alternate. This is why the assumption that after passage of an inflection minimum or maximum of function is reached is usually fair. The given assumption lies in a basis of the offered algorithm of quality of trading system functioning estimation. For defining an inflection point it is necessary to compare values of the second derivative of equity curve smoothing polynoms in adjacent points. If in point k-1 the value of the second derivative is positive, and in point k it is negative, it confirms the passage of an inflection point and moving to maximum (pic.1). If in point k-1 the value of the second derivative is negative, and in point k it is positive, it speaks for moving to minimum (pic.2). While moving to maximum it is necessary to admit trading system inefficiency, while moving to minimum it is necessary to admit its effectiveness.
In inflection points also the first derivative changes the direction of movement. Use of the first derivative is more desirable for the following reason. Differentiating means loss of some information on function character and behavior. The more the degree of a derivative is, the less information it gives. That is why both approaches (analysis of first and second derivatives) should be used to define inflection points. Joint use of first and second derivatives analysis is also possible. These analyses can complement or confirm each other. In case of complementing we state that a trading system functions efficiently if at least one method states this. In case of confirmation a trading system is said to be efficient only if both methods state it. All four offered algorithms (use of the first derivative, use of the second derivative, use of complementing signals, use of confirming signals) have been tested on historical data. Day Close values of EUR\USD currency pair for the period from 01.01.2002 till 30.05.2003 were used (total 369 trading days). The described algorithms were applied to control the quality of MACD based and Stochastic based trading systems. Table 1 and table 2 show two trading systems characteristics while using four algorithms and while not using them.
The data in tables allow to speak about high efficiency of the offered adaptive algorithms. The quantity of unprofitable transactions was essentially reduced, the share of profitable transactions in their total quantity increased. The size of maximal loss and the quantity of consecutive unprofitable transactions decreased. The final result of trades increased. And the main point – risk of the trader substantially decreased which means that the basic purpose of adaptive trading systems construction was reached. Literature
|
Resume
|
Biography
|
Library
|
Links
|
Research report
|
About preference
|

