|
INTRODUCE
Every latest discovery in physics or engineering will inevitably finds expression in medicine; striking example is the discovery of X-rays and his brilliant introduction into medical practice. Computer tomography (CT) can be regarded as a new stage in the development of radiology, in turn, the principles of mathematical analysis in the construction of images in CT were the basis of recent modern developments.
These CT-data can be used for diagnostic functions, and, most importantly, it can be successfully applied not only to detect pathological changes, but also for evaluating the effectiveness of treatment, in particular anticancer therapy, as well as determining recurrence and associated complications. Diagnosis by CT is based on direct X-ray symptoms, ie determining the precise location, shape, size of individual organs and pathological focus, and, most significantly, in terms of density.
In this paper we will review methods for the analysis of CT images of the abdominal cavity to assess the operability of tumors and constructing 3D - models.
1 Actuality of theme
1.1 Actuality of theme
Each year, more complicated in the country, especially in industrial regions, the ecological situation has led to an increase in the number of cancers among the population.
Of particular importance in oncology, an assessment of the patient, upon which the decision about surgical treatment. And, as shown by medical practice [1]
[2], the ratio of metastatic tumors and the volume of the primary tumor is very important for an evaluation of the outcome of the operation.
As a result, objective assessment of the implementation of this directly affects the quality and duration of the patient's life.
Determine whether or not the patient is operable can be based on clinical diagnosis, which is carried out using modern medical technology.
In hospitals, as well as diagnostic and antitumor centers one of the most important ways of such a diagnosis is computed tomography.
On examination of the man with the use of CT is performed to obtain a series of images with the help of one or more X-ray emitters and an array of sensors.
Tomography of internal organs has gained its popularity due to its high precision, information content and relatively low invasiveness.
1.2 Scientific innovation
Most modern scanners, available in health facilities are equipped with software that allows to perform basic operations of image processing, but lacks features available in conducting investigations.
Evaluation of shape and volume to select the strategy of treatment of tumors can be made automatic.
To do this, select neoplasm and the construction of its three-dimensional geometric model.
In practice, this feature is not available even in the software of modern scanners known manufacturers such as Siemens and General Electric, which are equipped with large diagnostic and anticancer centers.
This problem can be solved by implementing the missing functionality and its implementation in the workplace physicians that is relevant enough for today.
1.3 Aims and tasks of the work
To construct a three-dimensional model of the primary tumor in order to further assess its volume must have geometric models of all the projections of the object on each slice.
Therefore, a priority that must be addressed is the segmentation of the slices to be allocated to each of the object and the coordinates of points of its contour.
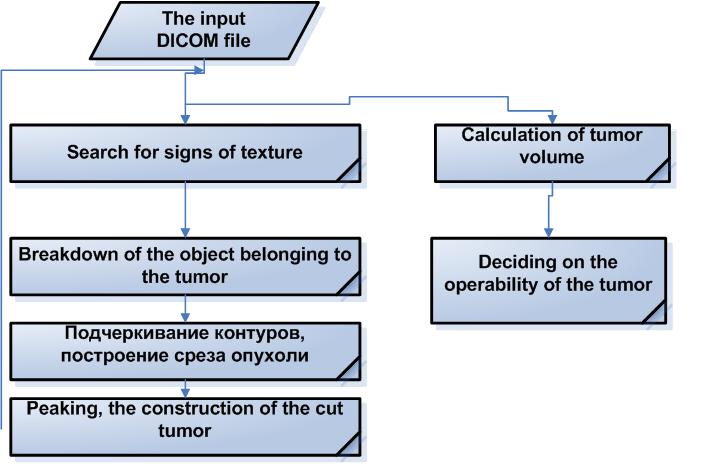
Figure 1.1 — Scheme of the subsystem.
2 ANALYSIS OF EXISTING TOOLS
Consider the functionality of systems that allow glances information in the form of DICOM-file and analyze it.
DICOM (born Digital Imaging and COmmunications in Medicine ) — the industry standard creation, storage, transmission and visualization of medical images and documents examined patients.
System Julius — a computer program that allows to work with DICOM files.
Basic functions:
— reading DICOM-faylov/serii files;
— save data in DICOM / JPEG formats;
— change the color, brightness, contrast images;
— the possibility of building sections in three planes.

Figure. 2.1 — Julius user interface.
System Jivex — software to work with the data obtained from computed tomography of bones and joints.
Options:
— read DICOM-image, a series of images;
— zoom, rotate, change image settings;
— change of density, color image parameters;
— to search for anomalies in the photograph of the joints and bones;
— image segmentation.

Figure. 2.2 — Jivex user interface.
However, most systems for processing CT images provide only minimal opportunities to work with data.
CT of the abdominal cavity is difficult to separate the tumor from the body, as well as to calculate its bulk characteristics. To make a decision on the operability of the tumor must have a good 3D-model.
The function of geometrical model is not even in the software of modern scanners known manufacturers such as Siemens and General Electric, which are equipped with large diagnostic and anticancer centers.
3 IMAGE SEGMENTATION
3.1 General concepts of segmentationи
The task of image segmentation is quite common, as the recognition of different types of images involved in many domestic and foreign scientists.
Segmentation of images obtained by computed tomography (hereinafter CT images), devoted numerous articles, scientific papers and books, as well as conducted a large number of studies.
There is a lot of development, based on gradient methods with a threshold, often found work, based on the method of the watershed
[3], on the use of deformation models [4], in particular, the method of active contours.
However, all these methods consider only the ability of tissues to absorb X-rays, since they are based on an analysis of the brightness of image points.
However, they are very sensitive to contrast and do not account for differences in the structure of tissues, which may be useful for separating the image of the tumor from healthy tissue organ or partial substitution of other organs
3.2 Segmentation using wavelet transform
Wavelet analysis allows the well to take into account local features of images
[5] [6], it is therefore proposed to perform segmentation of CT images with it. This requires:
— select type of conversion;
— define the parameters of transformation, such as the type of basis function, the size of the aperture and the desired number of levels;
— define a set of texture features for the further implementation of the classification;
— assess the effectiveness of segmentation.
There are several types of wavelet transform: continuous, discrete, dyadic and batch conversion.
Each type of transformation has several features that define its scope.
Dyadic wavelet transform, first proposed by Mallat [8], is a faster version of the discrete transform and can be used for image analysis.
Consider Bole detail how this can be used to highlight the contours of objects in the image.
As shown in [9], any function s (t) can be represented as a series:
(3.1)
where the projection of the signal at the orthogonal basis function expansions are computed as the scalar product
(3.2)
Designating a and b are coefficients of scale and shift to ψab(t) = |a|-1/2ψ[(tb)/a] we have:
(3.3)
Equation (3) represents the continuous wavelet transform, and ψ(t) — its basis. In the case of a discrete signal formula (3) has the form
(3.4)
where ψmk(t) = |а0|m/2&psi(аm0t-k), m — the scale parameter, k — shift parameter. In the case where a 0 is chosen to be 2, we obtain the dyadic wavelet transform.
As shown in [7] is an algorithm for computing dyadic wavelet transform proposed by Mallat can be used to find the objects in the image. This approach is justified by the following considerations:
— dyadic wavelet transform can provide enough information from the high frequency region, and in this case does not have the redundancy of the continuous transformation;
— wavelet transform allows you to search the border with the use of multiscale representation of discrete signals.
To find the proposed use of wavelet Mallat and smoothing the result using the Gaussian to combat small-scale noise.
Basis functions of wavelet transform have the form shown in equation (4).
(3.5)
To find the boundary is proposed to use a separate row and column transform the image in several scales.
The number l is defined as l = [log2 (N)], where N — the size of the processed image. At each step of the wavelet transform is applied separately to the rows and columns of the image, by analogy with the calculation of the gradient in the vertical and horizontal direction.
As a result, we obtain two filtered images for which we can calculate the moduli space conversion
(3.6)
and space phases:
(3.7)
The point is proposed that belongs to the boundary of the object if the corresponding value of the moduli space (6) more than the other two values in the direction of the gradient, which can be determined from the calculated phase space (7).
In this paper, a combined search for the maximum modulus at the required level of decomposition with the amputation unnecessary limits on the threshold, defined as
(3.8)
where M — the size of the moduli space horizontally and vertically.
It is proposed to determine the threshold to include only the neighborhood of the image, which gets an object that does not take into account when calculating the contour obtained by reflecting X-ray emission from the table.
It is not difficult, especially when processing images obtained from the same apparatus, as the table moves almost fixed.
3.3 Use watershed method in image segmentatiion
It is proposed to consider the image as a certain map areas, where the brightness values represent the values of heights on some level.
If this area to fill with water, then formed pools.
With further filling with water, these pools are combined.
Places of combining these basins are marked as a line of the watershed.
Separation of touching objects in the picture is one of the important tasks of image processing.
Often, to solve this problem using the so-called marker watershed.
Under a transformation using this method to determine the catchment “pools” and “line of the watershed” in the image by processing the local areas according to their brightness characteristics.
The method of marker watershed is one of the most effective methods of image segmentation.
If you implement this method, the following basic procedures:
— function is evaluated for segmentation. It deals with images, where objects are placed in dark areas and are partly obscured.
— calculation of markers foreground images. They are calculated on the basis of analysis of connectivity of pixels of each object.
— calculation of background markers. They represent the pixels that are not parts of objects.
— modification of the functions of segmentation on the basis of the values of the location markers of the background and foreground markers.
— calculation based on the modified segmentation function.
Summary algorithm works:
— the application of Sobel gradient for finding the boundaries of contours;
— the application of morphological technologies for marking objects foreground;
— calculation of local maxima to determine markers of foreground objects;
— the imposition of markers on the original image.
4 SEGMENTATION RESULT
Consider a CT image slice of the abdominal cavity of the patient, whose cancerous left kidney and work on it in two ways.

Figure. 4.1 — Segmentation based on wavelet transforms.
using the classifier of Euclidean distances and complete feature set and only the expectation of low-frequency space of the second level
(Animation: volume — 14,6 KB; size — 158x153; number of frames — 4, the delay between shots — 2000 ms delay between the last and first frames — 0 ms, number of cycles of repetition — forever).

Figure. 4.2 — Segmentation based on the watershed method
(Animation: volume — 20,3 KB; size — 164x164; number of shots — 3, delay between shots — 1500 ms delay between the last and first frames — 0 ms, number of cycles of repetition — forever).
REFERENCES
1. Привалов М.В., Скобцов Ю.А., Кудряшов А.Г., Сегментация компьютерных томограмм на основе вейвлет-преобразования.
2. Бондарь Г. В., Кудряшов А. Г., Борота А. В., Анищенко А. А., Осипенков Р. А. Расширение показаний к оперативному лечению больних раком почки // 5 съезд онкологов и радиологов СНГ. Материалы съезда. 14-16 мая 2008г. Ташкент. — С. 358.
4. Pil Un Kim, Yun jung Lee, Youngjin Jung, Jin Ho Cho, Myoung Nam Kim, Liver extraction in the abdominal CT image by watershed segmentation algorithm // World Congress on Medical Physics and Biomedical Engineering 2006: IFMBE Proc. — 2007. — Vol. 14. — pp. 2563-2566.
5. M.S. Atkins and B. Mackiewich. Automatic Segmentation of the Brain in MRI. Conference on Visualisation in Biomedical Computing 96, Springer-Verlag Lecture Notes in Computer Science, 1131:210-216, Sept. 1996.
6. Haralick R.M., Shamnmugan K., Dinstein I.H. Texture features for image classification // IEEE Trans. Syst., Man. Cyber. — 1973. — Vol. SMC-3. — P. 610.
7. Atam P.D., Yateen C., Kaiser-Bonasso C. Analysis of Mammografic Microcalcifications Using Grey-Level Image Structure Features // IEEE Trans. on Medical Imaging. — 1996. — Vol. 15, № 3. — P. 2.
8. И.М.Журавель. Image Processing Toolbox. Краткий курс теории обработки изображений. [Электронный ресурс]: Режим доступа: URL: http://matlab.exponenta.ru/imageprocess/book2/48.php
9. Watershed Segmentation Algorithm for Medical Confocal Image Analyses Towards In Vivo Early Cancer Detection. Man Kin Derek Ho. Department of Biology, Johns Hopkins University. [Электронный ресур]: Режим доступа: URL: http://www.nnin.org/doc/2007nninREUHo.pdf
10. Сирота А.А., Соломатин А.И. Статистические алгоритмы обнаружения границ объектов на изображениях. — Воронеж: Вестник ВГУ, № 1, 2008. [Электронный ресур]: Режим доступа: URL: http://www.vestnik.vsu.ru/pdf/analiz/2008/01/sirota_2.pdf
While writing the given abstract the master's work has not been completed yet. The final date of the work completed is December, 1st, 2010. The text of master's work and materials on this topic can be received from the author or her research guide after the indicated date.
|


