


Introduction
Spot welding machine (SWM) are widespread in the industry. However, there are several problems associated with the design of power supply networks SWM, as well as their exploitation. Due to the fact that these machines have a small value of the inclusion and heavy loads, in the case of simultaneous operation, they create in networks large peak loads, and voltage fluctuations. Consequently, the mains supply must satisfy two conditions: 1) allowable heating, and 2) the permissible voltage drop.
Ensuring on outputs of any turned on car of rated voltage is the key, because it has a major influence on the process of weld and weld quality. The dependence of the welding quality of the voltage level is shown in Figure 1

Figure 1 – The dependence of discontinuity’s points efforts on voltage at the time of spot-welding of steel products 08kp with the part’s thickness of 0.8 + 0,8 mm (a), 1 + 1 mm (b), 1,5 + 1,5 (a), 2,5 + 2,5 mm (d)
The urgency of this development is associated with intensive use of SWM, which leads to the need for more accurate methods for calculating the loss of voltage and peak currents, since the existing methods are based on approximate calculations. The development of more accurate method would reduce the capital costs on the supply chain.
Work’s objective – development of the exact method of voltage’s loss and peak currents for the extensive network calculation, that supplies a group of spot-welding machines, to reduce the capital cost of the network.
Literature review
The development of the theory of stress was laid in the work of Tikhonov V.P., Kayalova G.M., Livshits D.S., Mukoseeva J.L. and others. In these works two methods for determining design loads have been proposed: a statistical method [1] and ordered diagrams method [2]. Both of these methods were based on theoretical analysis of load schedules using probability distribution curves, as well as on the processing of data obtained by experiment in factory networks.
In the "Interim guidelines for determining electrical loads of industrial enterprises ", released in 1961, as a basis was taken the method of ordered graphs. It is worth noting that proposed in this work calculation methods could not be applied to resistance welding machines, since they hadn’t a relatively uniform load schedule. Also the need to calculate the voltage loss in the networks of power and determination of peak load was added.
Existing nowadays guidance on the calculation of loads based [3] on modified statistical techniques [4].
Methods for determining values of peak loads and their duration have been described in the method of probabilistic simulation load schedule of Kayalov G.M.[5], and then developed in works of Kurennoy E.G. Also on this question Shteynike G.A. [6] and Wagin G.Y [7] worked.
In work of Mukha V.P. [8] a method for determining voltage deviation on the terminals SWM with a given probability was proposed.
In addition to methods of analytical calculation of electrical loads techniques of statistical modeling were developed [9].
Theoretical justification of the analytical method of calculating the maximum current and voltage drops in the supply SWM
To determine the peak load in the Temporal guidance [3], as well as in the work of Mukha V.P. [8], two-stage max model in which the maximum peak current is determined total load of the machine, the operating time of which coincided with a certain probability, is used.
On condition that fixed number of machines simultaneously turned on machines m their total momentum of the current Im is a random variable. Distribution of this quantity is determined by a complex of different set of individual pulses Ir and coefficients of turning on kвr of individual machines in a given group.
According to general principle of maximum model [10] рthe calculation of probable maximum Ix = Im.max = F(ex) is replaced by more simple. This model replaces a specified group of machines with the same equivalent number of machines, but only with two values of current pulses. Due to this the possible values of the random variable Ix for the equivalent groups are the same, so that mx1 сmx1 becomes deterministic value. This allows us to determine mx corresponding ех = 0,001 standard schedules.
Ordered vector diagram (AP) of machines’ loading is the basis of the two-stage diagrams. It takes into account the pulse Ir and duration of turning on kвr. Such a model is produced by reduction of the ordered diagram to the simplest form considering the impulses of two kinds: n1 machines with the biggest impulse and (n - n1) with the lowest calculated impulse.
Value of the basic parameters of the model is determined by the equality’s condition of its size and area of the original LOD:

where:
 .
.
Figure 2 – Ordered diagram SWM’s currents and its two-stage model
Value of calculated peak is determined by the formula:
where mx1 – calculated number of simultaneously working machines with the highest individual pulses (Fig. 3);
mx – located on Fig. 3 depending on
 & n
& n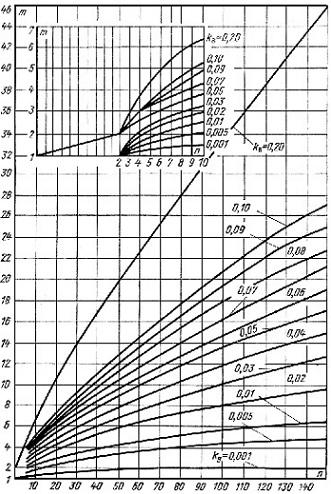
Figure 3 – Dependence of the estimated maximum mx number of simultaneous switching machines on their total number n for different values
Determination of the maximum voltage drop based on the method of fictitious loads, whereby the total voltage loss in the network at any given time is determined by the number of matched in work machine and loss of tension caused by the work of each machine.
Since the loss of voltage from the work of one machine is proportional to its current load, it can be regarded as fictitious load on this machine. This allows making calculation of the total maximum voltage drop similar to the calculation of peak load currents.
Voltage loss caused by each machine:

where
 –
coefficient that takes into account the total loss of voltage in the supply lines from loads of different phases of machines (Table 1);
–
coefficient that takes into account the total loss of voltage in the supply lines from loads of different phases of machines (Table 1);Table 1 – The value of coefficient for welding machines
| Type of machine | Calculated phase | ||
| AB | BC | CA | |
| single-phase | |||
| AB | 2 | 0,5 | 0,5 |
| BC | 0,5 | 2 | 0,5 |
| CA | 0,5 | 0,5 | 2 |
| biphasic | |||
| AB,BC | 2,4 | 2,4 | 1,73 |
| AB,CA | 2,4 | 1,73 | 2,4 |
| BC,CA | 1,73 | 2,4 | 2,4 |
| triphasic | |||
| ABC | 1,73 | 1,73 | 1,73 |
where rтр, xтр – active and reactive resistance of transformer, r0l, x0l – active and reactive resistance of plot of the mains supply to SWP.
Averaged voltage loss of a single welding machine:

Averaged voltage loss in the supply network from a group of machines:
The average coefficient of the inclusion of fictitious loads is the same for all line to line voltage, since it is defined for all machines of the group regardless of their distribution over the phases (and power):

From the equality of areas ordered diagrams and two-stage model is the number of welding machines, which create the maximum voltage drop

where
Estimated loss of voltage is determined by the formula:

Where ΔUmax, ΔUmin – maximum and minimum voltage drops. Magnitude mx и mx1 are similar to calculation of peak current.
The method of "Boundary distribution functions of peak currents and voltage drops SWM"
Method of calculation underlying the valid guidelines [2], relies on the use of two-stage model of ordered diagrams of welding SWM’s currents, which leads to errors and creates a certain margin at the time of power line selecting and, consequently, increases the capital cost to it.
Precise solution can only be obtained for a small number of welding machines in the group by trying all possible variants between switched at the same time SWM, calculating the probabilities of matches currents, voltages in the network and building on the findings the distribution functions of peak currents and voltage drops.
However, in practice it is only possible with a small number of welding machines because of the large number variants of switching, that significantly increases the amount of calculations. Since the actual number of machines can reach hundreds, the exact calculation in this case is impossible. To reduce calculation was proposed method of “boundary distribution functions” [11], that allows to identify areas needed for finding the maximum values and for the limiting distribution functions of the unknown quantities for each phase. These distribution functions allow us to find the maximum range of calculated loss of voltage values and peak currents. In the method of “boundary distribution functions” for reducing the numbers of stages of the distribution functions all the welders were divided into 7 groups depending on the number of phases and what phase any machine is connected to:
- single-phase, connected to the phases AB; BC; CA;
- biphasic, connected to the phases AB, BC; BC, CA; CA, AB;
In calculating of the distribution functions all possible combinations of switching a different number of machines of the groups are considered. The maximum distribution function we get, choosing from each group required number included WM of greatest power, minimum - the least. The method uses an algorithm of accurate calculation of currents and voltages, as well as in calculating the exact distribution function for a small number SWM.
The method of "Random selection"
It is obvious that using the calculated values of the loss of voltage, determined by the minimum distribution functions, we can not choose the mains supply, and use the maximum distribution functions will make a certain margin, as in all versions of the simultaneous switching of welding machines of the groups only the most powerful machines are selected.
To get more reliable results, a new method of "random selection" [12] based on the method of "boundary distribution functions” was developed. In it, as well as in the method of "boundary distribution functions, all the welding machines are divided into 7 groups, and the difference is that in calculating the distribution functions switched welding machines in each group were chosen randomly. After considering all possible variants, the distribution functions, which define the maximum values of peak currents and voltage drops, are built.
The method of "random selection" will be improved by taking into account the actual values of the coefficients of welding machines’ switching on condition of random switched machines’ choice in the group. In the current version of the method the probabilities of machines’ switching are identical, but in a modified - they will depend on their switching coefficients. The second way to improve the accuracy of the method of "random selection" is a calculation of several distribution functions of the same magnitude, followed by averaging the calculated values defined by each of them.
Other methods of calculation
In [13, 14] it is proposed to calculate peak loads, like loads of heat, on full power. The one-and two-phase SWM's are pre-allocated in three-phase network. Conditions and procedure for this distribution is given in [10].
Finding the estimated peak load is performed on the most loaded shoulders of three-phase network. In this case, the load of each single-phase and two-phase machine is brought to a three-phase load.

where
 – coefficient of reduction equal to: 2 – for single-phase machines that connect to the stress settlement shoulder and 0,5 – for single SWM, which are switched on two other interfacial tension.
For biphasic SWM one of the formulas is used:
First – if the biphase machine is switched on by only one shoulder on the calculated stress, the other – if not turned on by any shoulder. If  ,
respectively, we receive:
,
respectively, we receive:

Condition for this reduction is the equality of the voltage drop in the three-phase network, which one- or two-phase SWM and the reduced three-phase machine form.
To overcome the difficulties of further calculations, the group of triphasic and presented to them machines are replaced by one machine with maximum power  and conditional
  number of WM with the same conditional capacity of each machine.
Value and are determined by the formulas:
 – conditional coefficient of one machine switching after the change, equal to the average value of the coefficients
  of all SWM.
Since the voltage drop during peak load proportional to value of these loads, the calculation methods of probabilistic voltage loss
 are similar to methods of calculating the probability of peak loads that are given above.
The order of calculation
is as follows:
- For each i-th machine the value of loss of voltage received on those sections of the network before the calculated WM, which takes the power of i-th machine, is calculated.
- The conditional value of the coefficient of group switching Ky.y., which shall be equal to the average value of individual Ky.і. is calculate;
- The estimated machine with the maximum loss of voltage is chosen. Other
(n-1) WM with different Ky.і.
& ΔUі
зare replaced by conditional number nу
machines with identical Ky.y.
и ΔUі.у;
values Ky.і.
and
ΔUі
is calculated by formulas similar to those used to calculate the peak loads: full of capacities there are replaced by the corresponding voltage loss:

- The value of equivalent overlaps x on the interval of time
 , where
  –
the average value of welding time for all the WM, is found by the probability curves
–
the average value of welding time for all the WM, is found by the probability curves  .
Fig. 4 and 5 show the probability curves for
.
Fig. 4 and 5 show the probability curves for  and
and  respectively.
 - Find the value
of the formula
Figure 4 – Curves
 in
in 
Figure 5 – Curves
in
It is planned to develop on the basis of the proposed methods a universal method to calculate the branching network and network with two-way powered spot welding machines, to make a comparison of the developed methods with the methods proposed in [13, 14].
Literature
- Каялов Г.М. Определение расчетных нагрузок промышленных электрических сетей по методу упорядоченных диаграмм нагрузок // Материалы научно-технического совещания по определению электрических нагрузок и регулированию напряжения промышленных предприятий. Госэнергоатомиздат, 1958, вып.3. – C. 14–16
- Мешель Б.С. Применение математической статистики для определения электрических нагрузок промышленных предприятий. Энергосбыт Киевэнерго, Киев, 1958. – 128 c.
- Руководящий технический материал. Указания по расчету электрических нагрузок: РТМ 36.18.32.4 – 92: Утв. ВНИПИ Тяжпромэлектропроект: Введен с 01.01.93 // Инструктивные и информационные материалы по проектированию электроустановок. – М.: ВНИПИ Тяжпромэлектропроект. – 1992. – № 6-7. – C. 4–27
- Жохов Б.Д. Анализ причин завышения расчетных нагрузок и возможной их коррекции // Промышленная энергетика. – 1989. – №7. – C. 17–21
- Каялов Г.М. Принцип максимума средней нагрузки в расчетах электрических сетей. ИВУЗ, Электромеханика, 1964. – №3. – c.8–11
- Штейнике Г.А. Применение теории вероятностей и математической статистики для определения электрических нагрузок точечных машин контактной сварки. Труды Горьковского политехнического института, 1961, т.XVII, вып. 2
- Вагин Г.Я. Исследование режимов работы и расчет пиковых нагрузок машин контактной электросварки. //Электрические сети и системы, Межведомственный республиканский научно-технический сборник, 1970, вып.7. – C. 8–10
- Муха В.П. Вопросы теории и расчета электрических нагрузок и потерь напряжения в сетях контактной электросварки. // Диссертация на соискание ученой степени к.т.н. Ростовский-на-Дону институт инженеров железнодорожного транспорта, 1975. – 204 c.
- Мукосеев Ю.Л., Вагин Г.Я., Червонный Е.М. Расчет суммарной нагрузки машин контактной сварки методом статистического моделирования на ЦВМ. // Электричество. 1972, – №6. – C. 1–9
- Вагин Г.Я. Режимы электросварочных машин. – М.: Энергия, 1975. – 189 c.
- Воротніков С.О. Розрахунок напруг у електричній мережі, від якої живляться машини контактної зварки. Кваліфікаційна робота магістра – Донецьк, ДонНТУ, 2009. – 100 с.
- Болотнов Д.В. Розрахунок максимальних струмів і втрат напруги в електричних мережах живлення машин контактної електричної зварки. Кваліфікаційна робота магістра – Донецьк, ДонНТУ, 2010. – 100 с.
- Денисенко М.А Розрахунок пікових навантажень,що створюють установки для контактного електрозварювання в електричних мережах //Промелектро (Інформаційний збірник). – 2009. – №4. – C. 8–18
- Денисенко М.А Розрахунок втрат напруги в електричних мережах, що живлять установки для контактного електрозварювання //Промелектро(Інформаційний збірник). – 2009. – №5. – C. 31–40
- Теоретические основы аналитического метода максимальных токов и потерь напряжения в сетях контактной электросварки. / Г.М. Каялов, В.П. Муха, А.А. Бадахян, Л.Б. Годгельф // Инструктивные указания по проектированию электротехнических промышленных установок. – Москва.: ГПИ Тяжпромэлектропроект. – 1976. – №3. – С. 3–9