
Abstract
Content
- Introduction
- 1. Theme urgency
- 2. Goals and tasks of the research, expected results
- 3. Overview of studies and research problem statement
- 3.1 Overview of existing research and development
- 3.2 Research problem statement
- 4. Popular trading advisors testing results
- 5. Development of trading advisor morphological, functional and information models
- 5.1 The research object morphological model
- 5.2 The research object functional model
- 5.3 The research object informational model
- Conclusion
- References
Introduction
In the modern world one of the ways of financial investment is exchange trading. It should be noted that given the diversity of this type transactions objects the most popular way of the trading is a game on the differences of exchange rates, and the most developed market in this area is FOREX. In 2011, the daily turnover reached 4.5 trillion USD, and experienced traders can get a daily profit up to 5-7%, that with a sufficiently large size of the lot represents a substantial income [1].
Exchange trading of the studied type requires continuous analysis of the market situation, dynamics of quotations monitoring and regular positions opening/closing, that breakout trader from operating activities. In order to minimize time and optimize trading activities “trading robots” are currently in use.
1. Theme urgency
For today, there are about 800 different expert advisors that are based on a basic technical analysis and implement various trading strategies [2]. The advantage of the program over the man apparently – it is able to process large amounts of information, does not allow entry errors during positions opening and deprived of a psychological factor as the distraction of attention and fatigue. However, trading advisor which would consider a sufficiently large number of indicators, could be flexible in tactical decision-making, does not exist yet. The development of such trading robot is the goal of this study.
2. Goals and tasks of the research, expected results
The goal of the work is automation of trading on the FOREX market and development of effective multistrategic trading advisor.
The main tasks of the study:
- An analysis of existing of currency market trading, currency pair quotes forecasting and trading strategy building methods.
- An assessment of forecast errors and number of losing trades reducing ways.
- Search and identification of the existing methods of prediction and quotations course assessment characteristics and evaluation possibilities of their application in automated trading.
- The comparative analysis of the existing trading advisors and selection of trading component program implementation.
- Determination of the system to create structure, selection of elements, sub-systems and the mechanisms of their interaction.
Research object: the process of making deals with currency pairs and exchange rate quotations prediction.
Subject of research: association of forecasting techniques and trade by creating an automatic trading advisor.
The practical significance of the system being creating is to release human resources and increase trading economic benefits.
At the end of research will be created a configurable and functional automated trading systems with the following properties:
- trading at different time intervals and with different degrees of risk;
- multistrategy;
- automatic decision making on positions opening and closing;
- minimum number of input parameters (risk level).
3. Overview of studies and research problem statement
3.1 Overview of existing research and development
At present, the key element of trade, defining the behavior of a trader in the market, is a trading strategy (TS). TS – a set of analysis tools and rules, which trader is following for during his own work at the foreign exchange market. The simultaneous achievement of specified values of quotes gives a signal to buy or sell the trading instrument [3].
The basis of any TS responsible for the decision to start the trade, is the indicator used in. The mathematical apparatus of each indicator contains the results of the analysis, which is traditionally divided into fundamental and technical [4].
Under the fundamental analysis means a set of measures aimed at the behavior of exchange rates patterns identifying, the dynamics of supply and demand in the FOREX market, based on a comprehensive analysis of factors. Experts believe that the main negative of fundamental analysis – its complexity [5]. Necessity to control 40-50 indicators, each of which is defined by specific cause-and-effect relationships that have contradictory or reflective nature, the practical application of the prediction results is physically impossible even with a 50% confidence. The advantage of the method is the ability not to take into account fluctuations at the market (so-called market noise).
From the automated trading computer implementation point of view, technical analysis of the market and prices has bigger interest. All variety of forecasting methods of technical analysis fits into a certain pattern. So the works of foreign researchers developed into following classification [6]:
- Graphical methods, which help to predict the market using a visual image of his movements, vary depends on what type of schedule for construction.
- The filtering and mathematical approximation methods, such as moving averages and oscillators based methods. From the automatic trading advisor performance point of view that group is more attractive because the results of analysis are convenient to interpret by the algorithmic procedures.
- Cycle theory, which studies the cyclical fluctuations not only of prices but also natural and economic phenomena in general. This method has significant theoretical base, practical application of which is not yet sufficiently widespread.
There are also mixed methods, bearing the features of several groups. For example, Elliott wave theory – basically is a graphical method, but has the features of filtration and cycling. Thus, the majority of technical analysis methods fit into the classification set out.
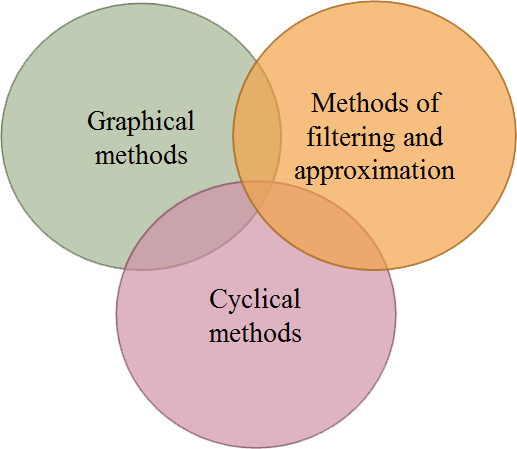
Figure 1 - Basic methods of technical analysis
Emam [9] showed that Artificial Neural Network (ANN) can be used to predict the Foreign Exchange market. However, he pointed out that it is not easy to implement a successful neural network model for predicting the FOREX market because of the various factors influence such as political events that generally take place over a period of time; such political crises strike suddenly and prices dry out quickly, and sometimes the spreads between bid and offer jump from 5 pips to 100 pips. In foreign currency exchange data stream, the number of real-time transactions is normally very large and distributed in high-density [10]. Furthermore, ANN will not evolve a good result without a good data preparation, input selections, variable selection, training algorithms and a predefined model for validation.
Slany proposed a self-adapting architecture for FOREX market prediction using genetic programming (GP) for predictor representation. The goal of the system is the design and adaptation of simple predictors which can either be used by the system itself or be “manually” used by a human trader. However, this system has a major drawback high ratio of wrongly predicted turning points [11].
Wedding and CIO proposed a hybrid model of radial basis function (RBF) networks and AutoRegression Moving Average (ARMA) models [12]. This methodology employs model combination.
Kablan extended the Adaptive Neuro-Fuzzy Inference System to create an expert system that is capable of using fuzzy reasoning combined with the pattern recognition capability of neural networks to be used in financial forecasting and trading. However, this is another instance of a hybrid system [13].
The Penn-Lehman Automated Trading (PLAT) project is a broad investigation of genetic algorithms and strategies for automated trading in financial markets. Subramanian et al presented the results of experiments conducted within this project and demonstrated that autonomous agents can achieve consistent profitability in a variety of market conditions, in ways that are human competitive. They also showed that show that it is possible to use qualitative characterizations of stochastic dynamics to improve the performance of these agents [14]. The experiments were however limited to the stock market [8].
The analysis allows identifying the main direction of the trading advisor formation. It is assumed that the adviser implements the trade at various time intervals and with different degrees of risk. The positions open/close decision fully provided to the robot. The only way for user to influence on the advisor is the level of risk – in the simplest case it is the percentage of the account funds, which can be involved in the trade, setting.
3.2 Research problem statement
The goal of the research is developing of multistrategic exchange trading robot for the currency market FOREX. Trading advisor must implement both short- and long-term trade transactions automatically determine the point of entry and positions closing moments to make decisions regarding the trading lot increase and apply various indicators of technical analysis. The user should retain the possibility to regulate the risk level.
According to this, the following problems are necessary to solve:
- to develop a framework for trading advisor, to highlight the main components and describe the mechanism of their interaction;
- to adapt or develop a mathematical tool for decision making in the various components of the advisor;
- to implement designed algorithms on the built-in to the trading platform programming language MQL4;
- to produce a numerical study of the marketing model and compare the results with the existing robots performance.
4. Popular trading advisors testing results
For the formation perceptions of effectiveness and profitability of existing trading advisors were selected six of the most popular ones.
Testing was conducted on seven market intervals (1 minute, 5 minutes, 15 minutes, 30 minutes, 1 hour, 4 hours, 1 day) for five time periods (01-10.02.13, 10-20.02.13, 20.02.13-01.03.13, 01.03.13-12.03.13, 12.03.13-14.03.13). To evaluate the effectiveness of trade net income, profitability, number of transactions, the percentage of profitable trades, short positions winning percent and the expectation of winning were analyzed. Statistics were collected using the MetaTraider 4 platform strategy tester. Averages for the five test series are presented in Table 1.
Table 1 – Summary of the trading advisors testing results
| Advisor name |
Test period | Net income | Profitability | Number of transactions |
Maximum drawdown |
% of profitable trades |
Short positions winning % |
Expectation of winning |
| Moving Average | M1 | -2026,4 | 0,132 | 246,4 | 2043 | 9,898 | 22,908 | -8,138 |
| M5 | -610,99 | 0,384 | 72,8 | 743,38 | 16,338 | 18,44 | -7,402 | |
| M15 | -234,29 | 0,456 | 25,4 | 342,32 | 18,66 | 16,666 | -8,93 | |
| M30 | -162,81 | 0,48 | 14 | 297,62 | 14,692 | 18,018 | -11,58 | |
| H1 | -198,98 | 0,32 | 6,8 | 249,34 | 23 | 16,666 | -27,8 | |
| H4 | -131,83 | 1,74 | 2,2 | 359,08 | 36,666 | 46,666 | -56,766 | |
| Daily | 8,8 | N/A | 0,2 | 18,8 | 20 | 20 | 8,8 | |
| Intraday | M1 | -8740 | N/A | 126,2 | 8748 | 0 | 0 | -69,262 |
| M5 | -8737,8 | 0,036 | 127 | 8755,8 | 6,932 | 6,932 | -68,934 | |
| M15 | -8047,1 | 0,132 | 114 | 8083,1 | 16,19 | 16,19 | -70,614 | |
| M30 | -6792,2 | 0,26 | 96,4 | 6852,4 | 20,512 | 20,512 | -68,154 | |
| H1 | -2927,7 | 0,508 | 61,4 | 3291,9 | 31,792 | 31,792 | -44,184 | |
| H4 | -1404,3 | 0,726 | 21,8 | 2216,66 | 38,43 | 38,43 | -61,71 | |
| Daily | -609,9 | 0,482 | 4,4 | 991,9 | 21,524 | 21,524 | -169,47 | |
| MACD | M1 | -40,72 | 0,07 | 2,2 | 68,48 | 28,572 | 12 | -15,432 |
| M5 | 12,28 | 0,572 | 5,4 | 85,33 | 73,334 | 70 | 6,526 | |
| M15 | 61,28 | 2,032 | 4,6 | 78,72 | 77 | 71,666 | 16,222 | |
| M30 | 69,09 | 1,358 | 3,8 | 94,95 | 73 | 60 | 18,194 | |
| H1 | 62,11 | N/A | 2 | 77,68 | 100 | 100 | 33,656 | |
| H4 | -8,04 | 0,14 | 1 | 50,56 | 53,334 | 40 | -2,014 | |
| Daily | 2,41 | N/A | 0,2 | 11,39 | 20 | 20 | 2,41 | |
| MACFibo | M1 | -1178,4 | 0,08 | 159 | 1180,4 | 5,908 | 7,716 | -7,33 |
| M5 | -402 | 0,222 | 57 | 410 | 15,672 | 19,822 | -6,932 | |
| M15 | -150,6 | 1,63 | 20 | 198,4 | 33,932 | 41,486 | -5,476 | |
| M30 | -11 | 1,176 | 11,2 | 78,888 | 50,96 | 40,666 | 3,51 | |
| H1 | -56,48 | 0,514 | 7,2 | 111,88 | 40,238 | 33,334 | -9,834 | |
| H4 | -19,79 | 0,072 | 1,2 | 42,79 | 30 | 40 | -19,69 | |
| Daily | 3,6 | N/A | 0,2 | 2,8 | 20 | 20 | 3,6 | |
| PSAR | M1 | -3154,7 | 0,598 | 464 | 4924,56 | 37,284 | 54,596 | -10,072 |
| M5 | -2373,8 | 0,784 | 457,8 | 9819,53 | 28,584 | 44,82 | -6,658 | |
| M15 | -2113 | 0,856 | 244,8 | 9296,21 | 45,552 | 60,368 | -6,932 | |
| M30 | -4636,3 | 0,194 | 118 | 9626,95 | 21,386 | 60 | -31,522 | |
| H1 | -5753,1 | 0,11 | 86,8 | 9587,76 | 10,196 | 20 | -67,71 | |
| H4 | 759,51 | N/A | 14,2 | 808,69 | 20 | 20 | 10,67 | |
| Daily | -1629,8 | N/A | 15,2 | 2079,36 | 0 | 0 | -21,444 | |
| X Traider | M1 | -13,19 | N/A | 1 | 174,78 | 40 | 40 | -13,13 |
| M5 | 73,7 | N/A | 1 | 163,52 | 80 | 60 | 73,7 | |
| M15 | 61,18 | N/A | 1 | 158,76 | 80 | 60 | 61,09 | |
| M30 | 6,84 | 10,6 | 1 | 190,04 | 60 | 40 | 6,84 | |
| H1 | 10,11 | N/A | 1 | 190,04 | 40 | 40 | 10,11 | |
| H4 | -27,9 | N/A | 0,8 | 141,56 | 20 | 20 | -27,94 | |
| Daily | -6,78 | N/A | 0,2 | 17,78 | 0 | 0 | -6,78 |
According to the results of the testing, most advisors have proven to be unprofitable (profit is not received, the money invested is not refunded in full). The exception is the trading advisor “X Traider”, but he made only one transaction for the entire period in 85% of cases, the rest time he didn’t trade at all, so despite the high rate of profitability, this advisor is not suitable for long-term automated trading.
A similar situation is observed in the analysis of the trading advisor MACD, installed in the MetaTraider 4 platform as default. Despite the fact that more than half of its trades are profitable (Figure 2), the expectation of winning is quite a small amount, and trade adviser measures testify about his unprofitability. In such a situation deposit investment is more favorable than investment in trading on the exchange rates.
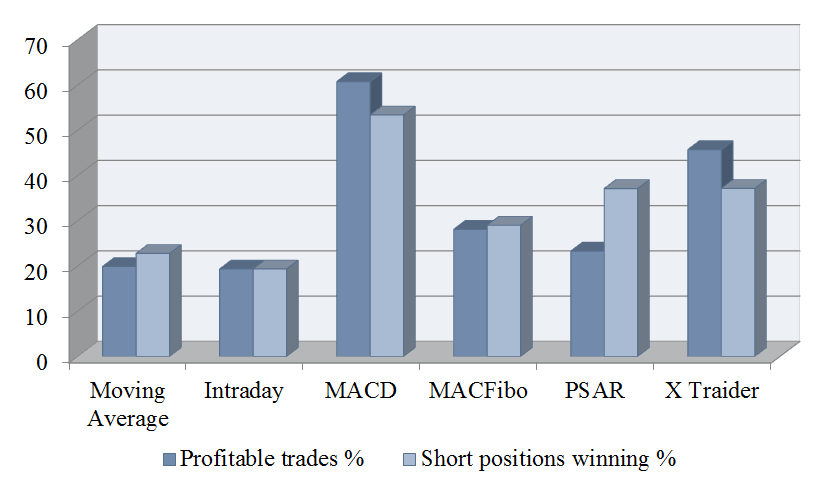
Figure 2 – Total successful transactions and short positions winning percentages
However, some trading advisors have shown good profitability for certain trading intervals. For example, the most popular trading advisor, based on the method of moving averages, provides effective trading on the four-hour interval (Figure 3).
Figure 3 – Moving Average and MACFibo advisors profitability chart
(animation: 7 frames, 10 cycles of repeating, 16 kilobytes)
According to the analysis, it was decided to use a trading advisor Moving Average as a basis of robot to build. This TA is successfully trading on a popular time interval H4, which is most often used by the least experienced traders as well as it has successfully implemented orders open/close unit.
5. Development of trading advisor morphological, functional and information models
Analysis of test results allowed us to determine developing advisors trading basis algorithm component. The main objective of this section is to develop an optimal structure of trading advisor, description of its main components and principles of their interaction. For a full description of the system a morphological, functional and information models need to be created.
5.1 The research object morphological model
5.1.1 The Black Box Model
The black box model is building in this section, it combines the system boundary model, the external environment model, the inputs and outputs models. The “Black Box” model presented at the Figure 4.
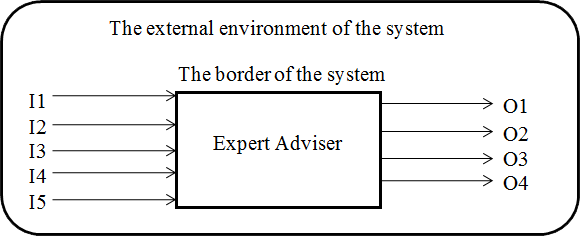
Figure 4 – Trading advisor “Black Box” model
The system boundary model
Conventional boundary of the system is the trading platform MetaTraider Nord FX. Trading advisor acts in the framework of this program and its usage outside of it is impossible.
Inputs model
Inputs model of the system is presented in Table 2.
Table 2 – Inputs model of the system
| I1 | Currency pair quotes |
| I2 | Account statement |
| I3 | An opened orders information |
| I4 | Applied trading strategy |
| I5 | Meta-management from the user or trading server |
Outputs model
Outputs model of the system is presented in Table 3.
Table 3 – Outputs model of the system
| O1 | Statement of an account |
| O2 | Order opening |
| O3 | Order closing |
| О4 | Order refreshment |
External environment model of the system
The external environment of the system is a commercial server Nord FX, which performs trading advisor. The server provides an advisor quote information, status of account, the opened positions data, as well as meta-management: stop out, market opening, force majeure, obvious error. Also the external environment includes user, which defines the trading strategy and can command to close all positions and stop trading.
5.1.2 Composition model of trading advisor
The composition model of the system is shown in Figure 5, a list of all subsystems and elements is shown in Table 4.
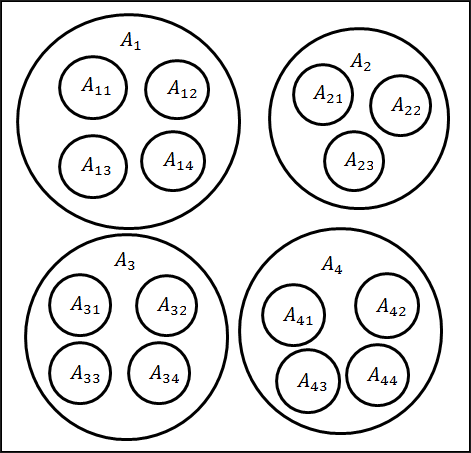
Figure 5 – Composition model of the system
Table 4 – Subsystems and elements list
| Subsystems and elements | ||
| A1 | Management component | |
| A11 | Quotes receiving element | |
| A12 | Geting meta-commands from trading server and user element | |
| A13 | Coupling with the user element | |
| A14 | Receiving account data element | |
| A2 | Analysis and forecast component | |
| A21 | Quotes history creation element | |
| A22 | Daily and weekly fluctuations analysis element | |
| A23 | Forecast building element | |
| A3 | Strategy building component | |
| A31 | Strategy and trade size choice element | |
| A32 | Application of the theory of games with the environment element | |
| A33 | Using situational fluctuations element | |
| A34 | Identification of trade variables element | |
| A4 | Trade component | |
| A41 | Trading strategy realization and termination conditions verification element | |
| A42 | Order opening element | |
| A43 | Order closing element | |
| A44 | Order refreshment element | |
5.1.3 The structure model of the system
Schematic representation of the system structure is shown in Figure 6.
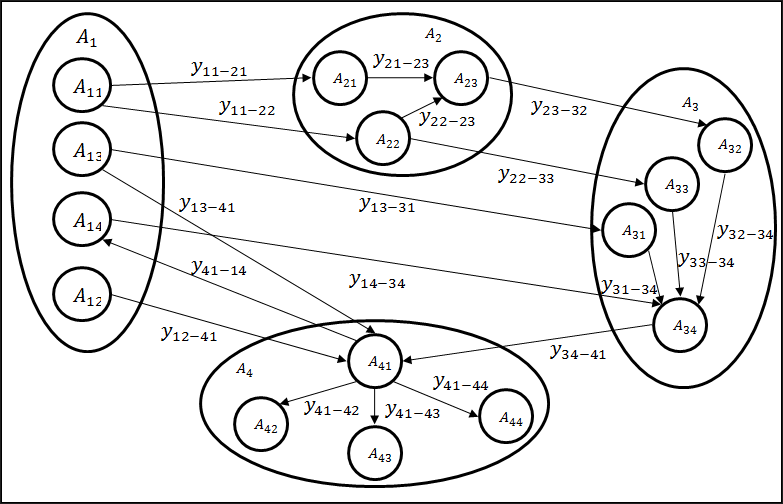
Figure 6 – Schematic representation of the system structure
Hypercomplex matrix of structural connections of the system is presented in Table 5.
Table 5 – Hypercomplex matrix
| A11 | y11-21 | y11-22 | ||||||||||||
| A12 | y12-41 | |||||||||||||
| A13 | y13-31 | y13-41 | ||||||||||||
| A14 | y14-34 | |||||||||||||
| A21 | y21-23 | |||||||||||||
| A22 | y22-23 | y22-33 | ||||||||||||
| A23 | y23-32 | |||||||||||||
| A31 | y31-32 | y31-34 | ||||||||||||
| A32 | y32-34 | |||||||||||||
| A33 | y33-34 | |||||||||||||
| A34 | y34-41 | |||||||||||||
| A41 | y41-42 | y41-43 | y41-44 | |||||||||||
| A42 | ||||||||||||||
| A43 | ||||||||||||||
| y41-14 | A44 |
Consider in details the relationship between elements of the system.
y11-21 – the received quotations transmission for the history formation;
y11-22 – the received quotations transmission for the analysis of daily and weekly fluctuations;
y12-41 – the server meta-commands to complete all transactions transmission;
y13-31 – the user-selected choice of strategy transmission to the trading lot selection element;
y13-41 – the user meta-commands to complete all transactions transmission;
y14-34 – the account information transmission to the defining trading variables element;
y21-23 – the generated quotation history transmission to the forecast building element;
y22-23 – the results of analysis of daily and weekly fluctuations transfer to the forecast element;
y22-33 – the results of analysis of daily and weekly fluctuations transfer to the situational fluctuations using element;
y23-32 – the generated currency quotes forecast transmission of application to the theory of games with the environment element;
y31-32 – user chosen strategy transmission to the application of the theory of games with the environment element;
y31-34 – user chosen strategy transmission to the trading variables identification element;
y32-34 – the results of application of the theory of games with the environment transmission to the trading variables identification element;
y33-34 – situational fluctuations using results transmission to the trading variables identification element;
y34-41 – formed trading variable transmission to the component of trade;
y41-14 – user account status report;
y41-42 – command to open an order;
y41-43 – command to close an order;
y41-44 – command to update an order.
5.2 The research object functional model
A functional model of the system is designed to study the characteristics (functioning) of the system and its use in conjunction with internal and external elements. A functional model of the system, developed in the environment BPWin 4.0 is shown in Figure 7.
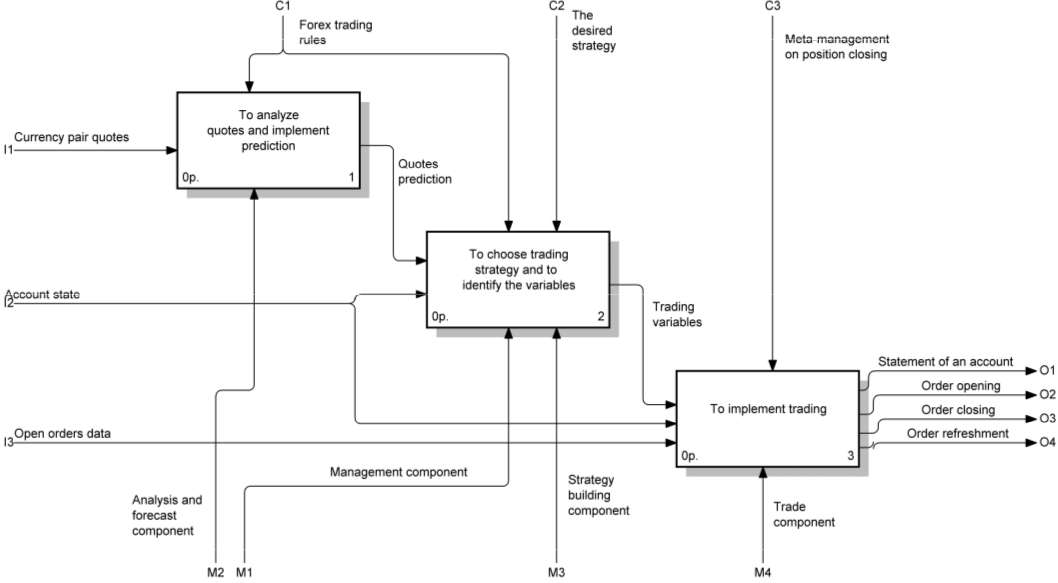
Figure 7 – Developed functional model of EA. Level A0
The model considers the main function of advisor – realization of foreign exchange trade. Thus regarded the basic inputs and outputs of the system, mechanisms and managements of the trading process. Then, the main function is decomposed into three subsidiary:
- to analyze quotes and implement prediction (Figure 8);
- to choose trading strategy and to identify the variables (Figure 9);
- to implement trading.
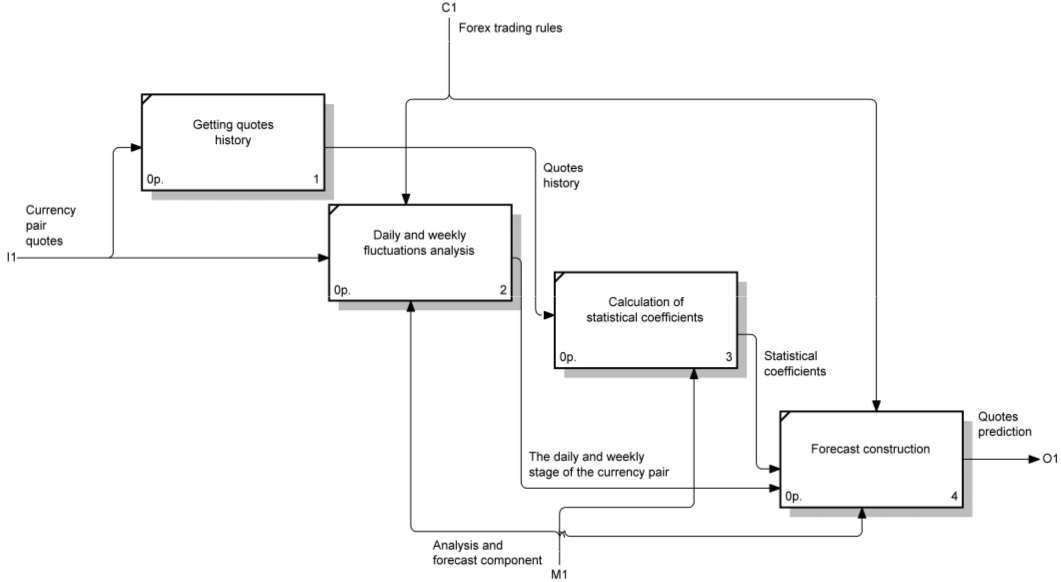
Figure 8 – Decomposition of block A1 “To analyze quotes and implement prediction”
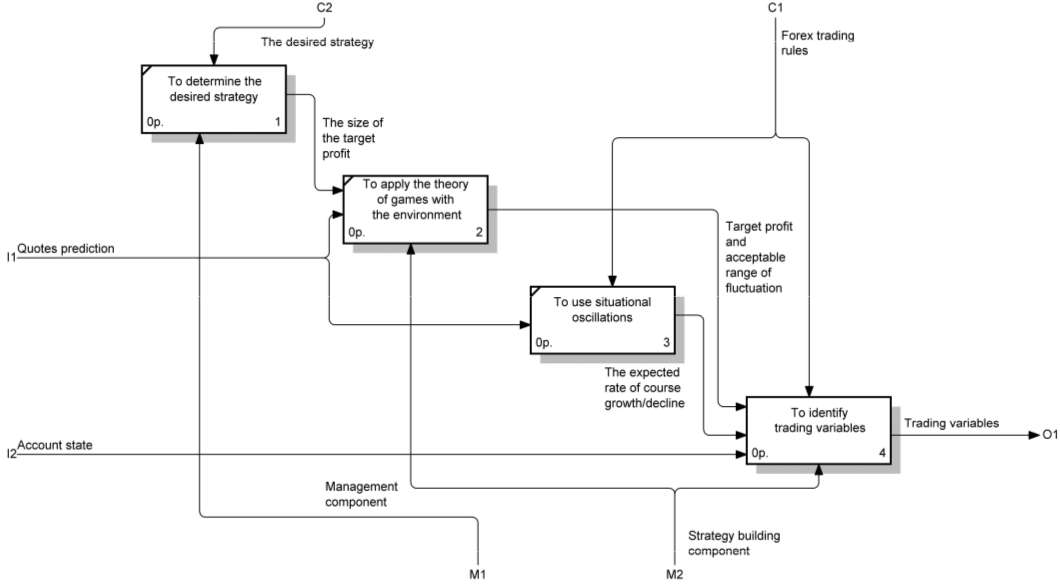
Figure 9 – Decomposition of block A2 “To choose trading strategy and to identify the variables”
Further, each of these functions are also decompose in more detail. Total model contains three levels of decomposition, each of which discussed and highlighted various support functions of subsystems of the object described by the mechanism of their interaction (Figure 10).
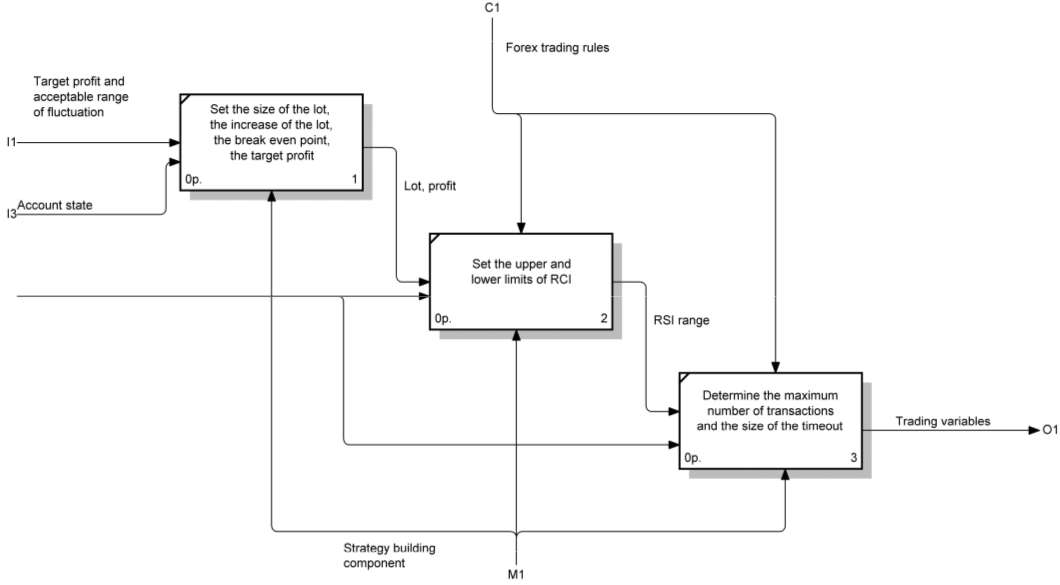
Figure 10 - Decomposition of the block A24 “Determine the trade variables”
In total, the structure of the advisor is allocated four main components:
- analysis and forecast component;
- management component;
- strategy building component;
- trade component.
5.3 The research object informational model
Information model – a model of the object represented in the form of information that describes the essential parameters for this discussion and the object variables, the connections between them, the inputs and outputs of the object and allows by supplying changes in input variables information to predict the possible states of an object. Two basic methods of information models building are DFD and IDEF3.
The purpose of DFD technique is to build a model of the system in form of Data Flow Diagrams (DFD), which provide the correct description of the outputs (the system response in the form of data) for a given exposure to the system input (feed signals through external interfaces). Data flow diagrams are the primary means of modeling the functional requirements of the designed system [7].
Figure 11 shows the decomposed context diagram A0, which handed down the basic objects of the external system – the trading server and the user that describes the external and internal data storage, as well as the mechanism of accumulation and transferring data between the subsystems and storage.
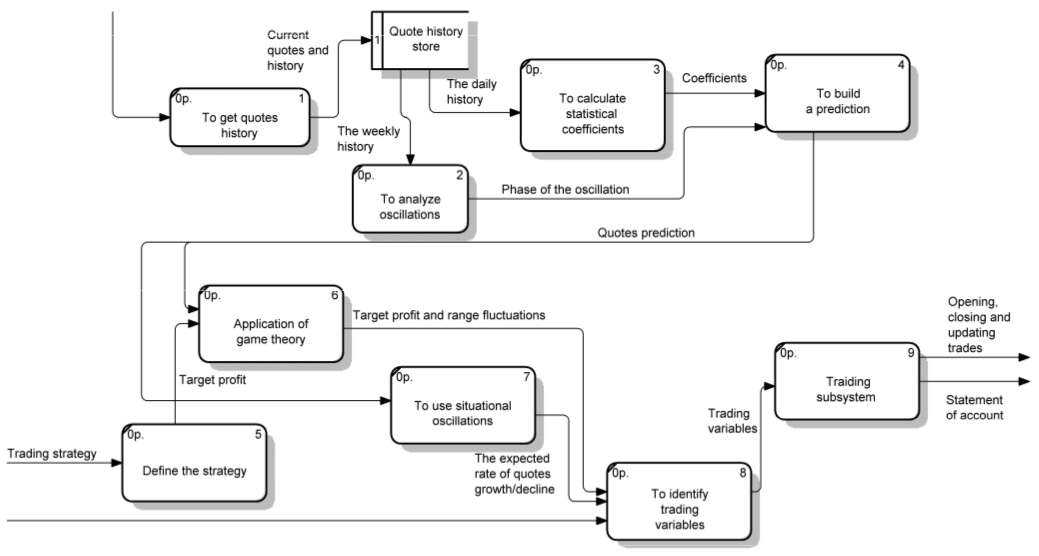
Figure 11 – Decomposition of the block “To implement trade at the currency market”. Level A0
The presence on the DFD diagrams elements to indicate the sources, receivers, and data warehousing allows for more efficient and clearly describe the workflow process. However, to describe the interaction logic flow of information is more suitable IDEF3, also known as workflow diagramming, – modeling methodology that uses a graphic description of the information flow, the relationship between processes and information processing facilities. A key feature of these diagrams is the presence of information crossroads (junction), which allow to identify the set of events that can or should be completed before starting the next one [7].
Main chart IDEF3, as well as two levels of decomposition are shown in Figures 12-14. In the diagrams, decomposition of a task quotes analysis and trading strategy selection contains asynchronous information crossings, which means that all the previous processes have to be completed.
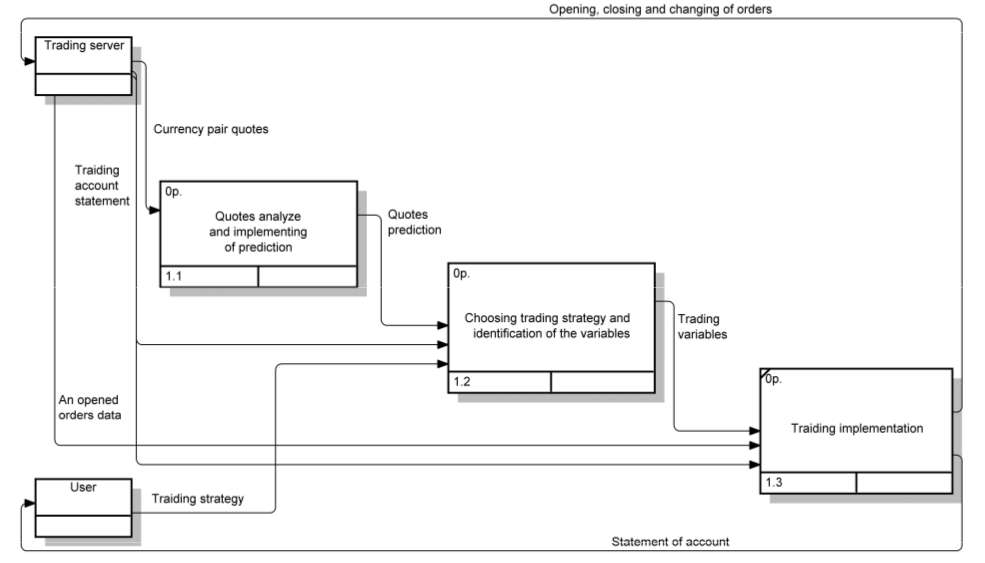
Figure 12 - Main context diagram IDEF3
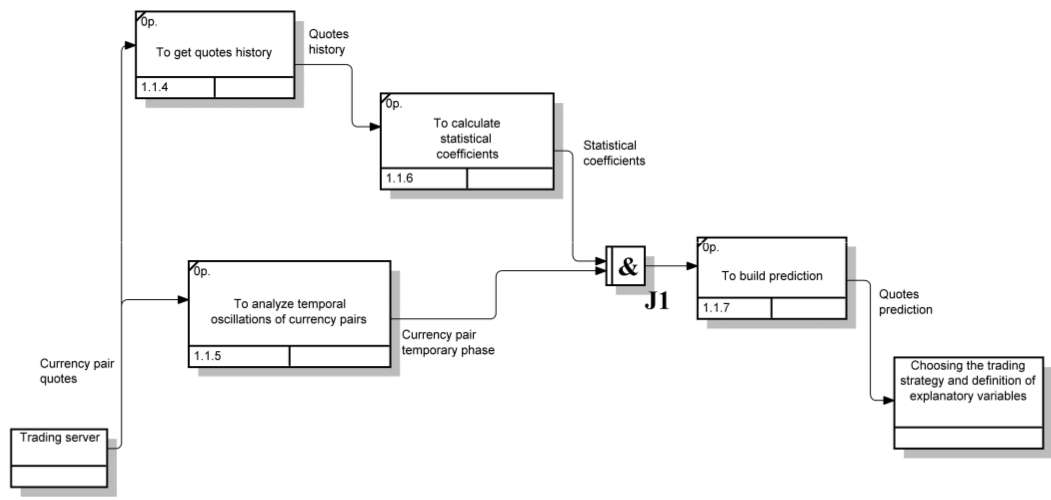
Figure 13 - Decomposition of the the block 1.1 “Quotes analyze and implementing of prediction”
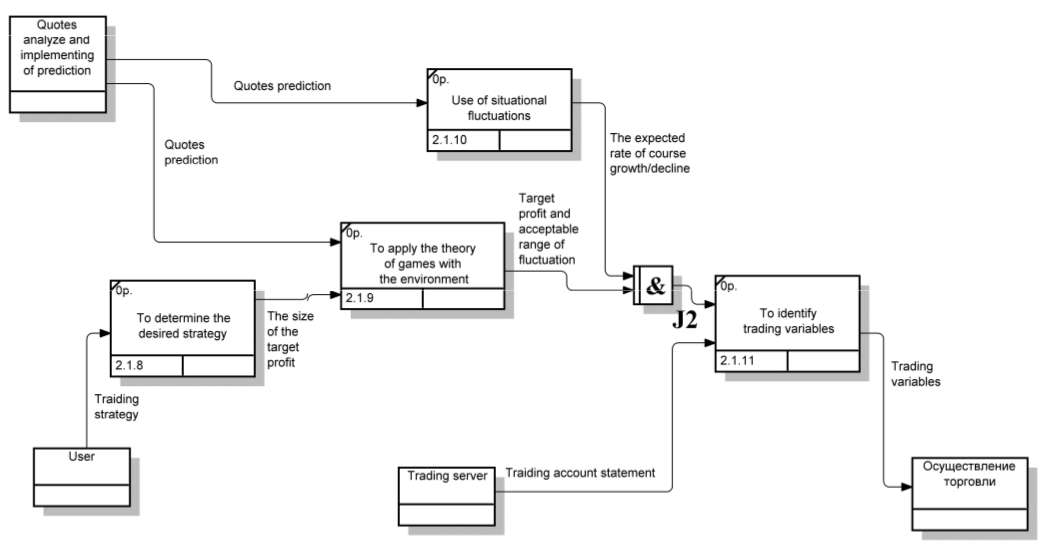
Figure 14 - Decomposition of the block 1.2 “Choosing trading strategy and identification of the variables”
Conclusion
Master’s work is devoted to the actual scientific problem of automation of trading. As part of the research carried out:
- The existing currency market trading, currency pair quotes forecasting and trading strategy building methods analyzed.
- The characteristics of existing methods of prediction and assessment of the course quotations identified and their automated trading potential evaluated.
- Comparative analysis of the most popular trading robots conducted, which confirmed their unprofitability or limited use.
- The requirements to trading advisor, stages of development and interim targets identified.
- The structure of system to create, outlines of elements, subsystems and how they interact were described. Morphological, functional and informational models of the system built, they describe all the main aspects of the research object.
According to the statement of the problem, further research direction is the selection, development and adaptation of mathematical models for the various components of the system, its software implementation and testing.
During writing this essay master's work is not yet complete. Final completion: December 2013. Full text of the work and materials on the topic can be obtained from the author or his head after that date.
References
- Лука Корнелиус Торговля на мировых валютных рынках (Trading in the Global Currency Markets) 2-е издание / К. Лука – М : Альпина Бизнес Букс, 2005. — с. 21-23. — 716 с.
- Эрлих А. А. Технический анализ товарных и финансовых рынков - прикладное пособие / А. А. Эрлих – М : ИНФРА-М, 1996. – 176 с.
- Мэнкью Н. Г. Принципы экономикс / Н. Г. Мэнкью – СПб : Питер Ком, 1999. – 784 с.
- Играть на бирже просто?! / НП «Форекс Клуб» – М : Форекс Клуб, 2003. – 240 с.
- Найман Э. Л. Малая Энциклопедия Трейдера / Э. Л. Найман – К : ВИРА-Р Альфа Капитал, 1999. – 236 с.
- Вайн Саймон Опционы. Полный курс для профессионалов / С. Вайн – М : Альпина Паблишер, 2003. – 416 с.
- Маклаков С. В. Моделирование бизнес-процессов с BPWin 4.0 / С. В. Маклаков – М : ДиалогМИФИ, 2002. – 220 с.
- David A. Oyemade, Godspower O. Ekuobase, Fidelis O. Chete Fuzzy Logic Expert Advisor Topology for Foreign Exchange / Proceedings of the International Conference on Software Engineering and Intelligent Systems 2010 (SEIS 2010), July 5th-9th, Ota, Nigeria, Vol 1, p. 215-228
- Emman A. Optimal artificial neural network topology for foreign exchange forecasting / ACM Southeast Regional Conference, Proceedings of the 46th Annual Southeast Regional Conference on XX, pp. 63-68, ACM New York, NY, USA (2008)
- Lin, L., Cao, L., Zhang, C. The fish-eye visualization of foreign currency exchange data streams. / ACM International Conference Proceeding Series; Vol. 109 proceedings of the 2005 Asia-Pacific symposium on Information visualisation – Volume 45, pp. 91 -96, Australian Computer Society, Inc. Darlinghurst, Australia, Australia, (2005)
- Slany, K. Towards the Automatic Evolutionary Prediction of the FOREX Market Behaviour / IEEE International Conference on Adaptive and Intelligent Systems, pp. 141-145, IEEE Computer Society, Los Alamitos, CA, USA (2009)
- Wedding, D. K., Cios, K. J. Time series forecasting by combining RBF networks, certainty factors, and the Box-Jenkins model / Neuro computing, pp. 149-168, (1996)
- Kablan, A. Adaptive Neuro Fuzzy Inference Systems for High Frequency Financial Trading and Forecasting / Third International Conference on Advanced Engineering Computing and Applications in Sciences, pp. 105-110, , IEEE Computer Society, Los Alamitos, CA, USA (2009).
- Subramanian, H., Ramamoorthy, S., Stone, P., Benjamin, J. K. Designing safe, profitable automated stock trading agents using evolutionary algorithms / Proceedings of the 8th annual conference on Genetic and evolutionary computation, pp. 1777-1784, ACM New York, NY, USA (2008)