 FR
FR

| Autobiography | The Journey of life | DonNTU | Master's portal | |||||||||

Ajayi Adekunle Babatope
Faculty: Electrotechnical (ETF)
Department: Electrical Power Plants (EPP)
Speciality: “Electrical Power Plants” (EPP)
Scientific Supervisor: Pavlukov Balery Alexandra
Abstract
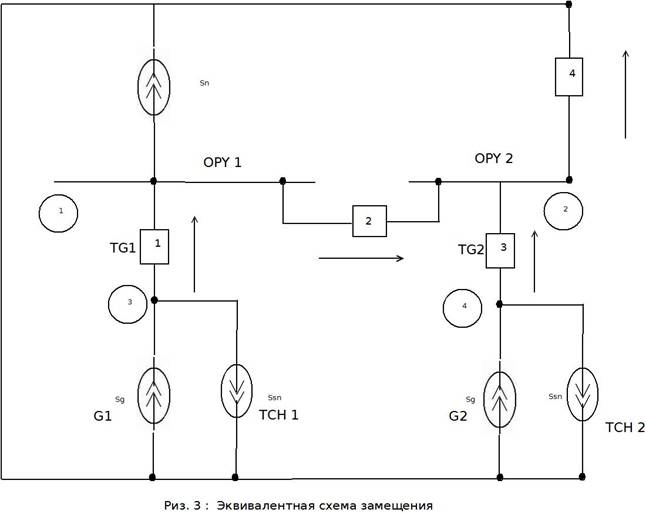
For The Master's Scientific Research Thesis: COMPUTER AIDED DESIGN OF ORGANIC FUEL POWER PLANT FOR DEVELOPING AFRICAINTRODUCTION The explanatory note of the sections is stated as follows: 1. A choice and the description of the main diagram of designed electrical installation. The design output of the power plant is generated below: – The Main diagram of an electrical installation. 1 DEVELOPMENT OF THE PROGRAM OF COMPARISON OF VERSIONS DIAGRAM OF DELIVERY OF CAPACITY THERMAL POWER STATION BY CRITERION OF THE MINIMUM OF THE RESULTED EXPENSES OF THE ELECTRIC PARTS. The electric part of power stations includes the power stations connected among them the main electric diagram (Hydro Power Station) and the diagram of own needs. Hydro Power Station substantially influences the quality indicators of an electric part, as well as all power stations (reliability, profitability, maintainability, convenience of operation, etc.). The diagram is indissolubly connected with a power supply system in which is networked through the transformers on Electric Power Transmission generators of power station giving out developed electric energy. Influence as power stations on progress of a power supply system, and a power supply system on choice Hydro Power Station is observed. Choice of Hydro Power Station represents a complex technological problem. The account of all factors at a choice of the diagram is possible only at use of the automated system of design. The problem of choice essentially becomes complicated if to consider and influence the diagram of a power station. Requirements to the main electric diagram of power stations of various types are regulated by types of technological design of power stations. Design of Hydro Power Station is carried out in the following sequence: the diagram of accession of power station to a power supply system gets out, the diagram of delivery of capacity gets out, diagrams of the raised pressure get out, calculation of currents bridging is carried out, electric devices and current going out. The design of the diagram of accession of power station solve problems of a choice of value and number of pressure on which capacity of station protrudes numbers, directions and put through Electric Power Transmission on each pressure, desirable distribution of generating capacity between different pressures. The diagram of delivery of capacity defines distribution of generators between different pressure, transformer (autotransformer) communication between different pressure, a way of connection of generators with block transformers and points of connection of transformers of Hydro Power Station. At design of the diagram of delivery of capacity of station at the first stage, versions of its execution are outlined. On the second stage for each version overflows of capacity through block transformers and autotransformers of communication are defined and their choices are carried out, losses of energy are calculated, the damage from unreliability of work of elements of the diagram is defined, there are capitals, operational and resulted expenses. The feasibility report on an accepted version maybe is carried out by comparison of versions of possible design decisions, the use of criteria of comparative economic efficiency Capital investments (a time of recovery of outlay, the specific efficiency, and the resulted expenses). Economic comparison of versions is made by definition of the rated resulted expenses. The economically attractive diagram is defined by the minimal resulted expenses. As a result of comparison of versions of the diagram of delivery of capacity thermal power station by criterion of a minimum of the resulted expenses, the rational version comes to light. Thermal Power Plant Construction Thermal station (Thermal Power Plant) is a plant used in producing energy and can also be defined as a heat source in district heating supply source of the city (central heating, hot water). Figure A. Typical diagram of a Power Plant System 1.1 DEFINITION OF AN OVERFLOW OF CAPACITY FOR A CHOICE OF THE AUTOTRANSFER For this purpose it is necessary to enter vectors of capacity of generators Pg (МВА), factors of capacity Cos f, a vector, defining % of own needs of % _SN, the vectors defining what generators does in a normal mode g_ru and in emergency operation g_rua are attached. Maximal load S.mn (MW) is specified. The full power of the generator (МW) pays off under the formula:
Overflow of capacity through winding CН: Overflow of capacity through winding ВН: In emergency operation at switching-off of one block ORU-1 total capacity on ОРУ-1 will be defined: if g_ruai=1 Overflow of capacity in emergency operation on winding СН:
For single phase of an autotransformer:
S – Rated power of the transformer (МW); Figure. 4: Thermal Power Plant Construction 1.2 CALCULATION OF LOSSES OF CAPACITY AND THE ELECTRIC POWER P.kz – a vector of loss of short circuit (kw); Losses of the electric power (kw) are defined under the formula Figure. 5: Design of Thermal Power Plant Construction. 1.3 DEFINITION OF THE FULL RESULTED EXPENSES Where To – capital investments (NGN);
|





















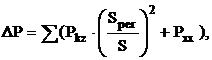

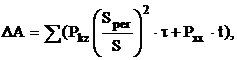












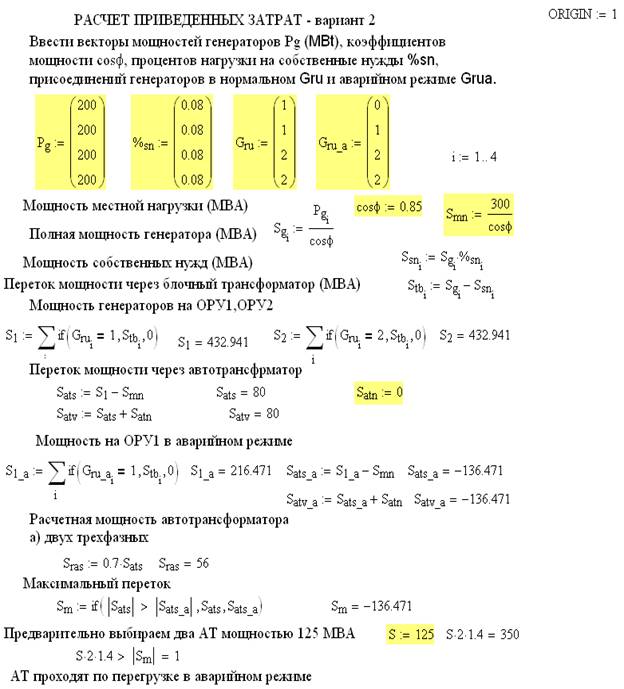
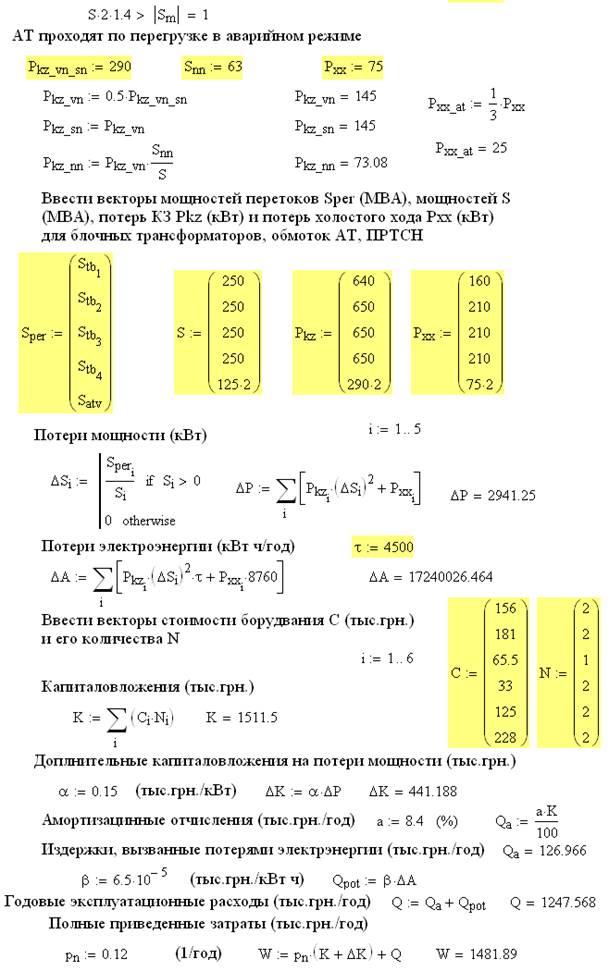
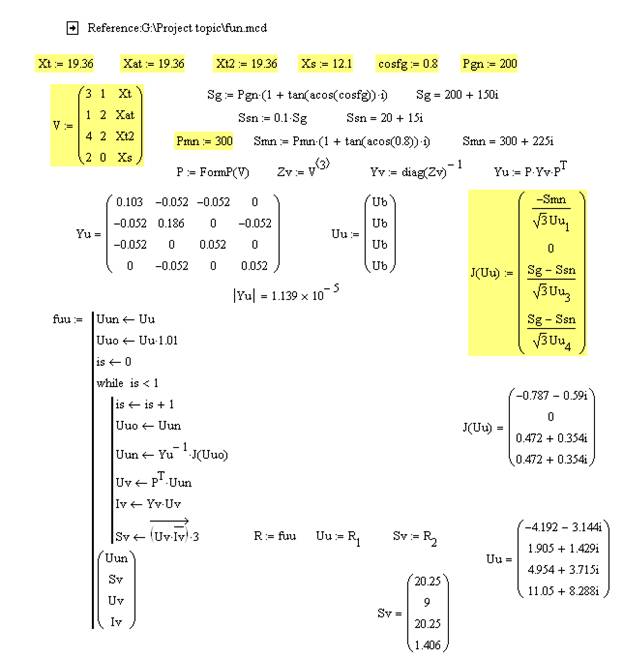
Fig.1 The program for calculating the power design cost
Continuation of Fig. 1
|
 =
=  ?
?  (2.1)
(2.1) – A vector of tensions is in the basic calculation of chart
 – The key is the square matrix
 – Vector of currents
 = P ?
= P ?  ?
?  (2.2)
(2.2) –Swiftness of branches with square matrix
 = diag
  (2.3)
(2.3) – Branches of vector resistances
 =
=  (2.4)
(2.4) – Calculation of Power of node set
 – Current value of node tension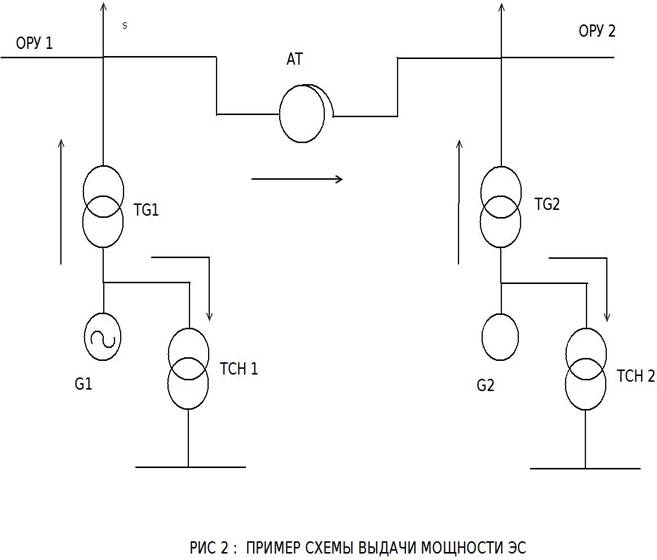
Literature Review
1. Кужеков С. Л. Проектирование электрической части электростанций и подстанций. Новочеркасск 1995, 7 - 10.
2. Сивокобыленко В.Ф., Павлюков В.А. Расчет паpаметpов схем замещения и пусковых хаpактеpистик глубокопазных асинхpонных машин, "Электpичество", 1979.
3. Методические указания по испытаниям электpодвигателей собственных нужд электостанций и pасчетам pежимов их pаботы пpи пеpеpывах питания, СПО Союзтехэнеpго, М, 1983.
4. И.П. Заболотный, В.А. Павлюков Пpименение компьютеных технологий для упpавления электpическими системами, "Технична электpодинамика", Киев, 1998.
5. Сивокобыленко В.Ф., Костенко В.И. Математичне моделювання електродвигунив власних потреб электрических станций. Донецьк, ДПІ, 1979. – 110 с.
6. Сивокобыленко В.Ф. Перехидни процеси у багатомашиних системах електропостачання електростанций. Уч. посибн, Донецьк, ДПІ, 1984. - 116 с
7. Георгиади В. Х. Методика розрахунку режимив перерви живлення и самозапуску електродвигунив 3-10 кВ власних потреб електричних станций спрощеними методами. – М.: СПД ОРГРЕС, 1993 р, - 139 с.
8. Методични вказивки до випробування ЕД власних потреб електричних станций и розрахунку режимив их роботи при перервах живлення. Пид редакциєю Георгиади В. Х.: – М.: СПД Союзтехенерго, 1983 р, 2 частина.
9. Ойрех Я. А., Сивокобыленко В.Ф. Режими самозапуска асинхроних двигунив. - М.: Энергия, 1974. – 96с.
10. Сиромятников И.О. Режими роботи асинхроних и синхроних двигунив / Пид ред. Л.Г. Мамиконянца :– М.: Енергоатомвидавн, 1984. – 240 с.
11. Георгиади В.Х. Поведение энергоблоков ТЭС при перерывах электроснабжения собственных нужд – М.: НТФ “Энергопрогресс”, 2003. – 88 с.; ил. [Библиотека электротехника, приложение к журналу “Энергетик”; Вып. 6 (54)].
12. Лирин В.Н., Георгиади В.Х. Методические указания по испытаниям электродвигателей собственных нужд электростанций и расчетам режимов их работы при перерывах питания – М.: СПО “Союзтехэнерго”, 1982г. –[Часть1, Часть2].
13. Баков Ю.В. Проектирование електрической части електростанций с применением ЭВМ: Уч. пособ. – М.: Енергоатомвидавн, 1991. – 272 с.
Copyright © 2010 Designed by Ajayi Adekunle Babatope
