
Development of methods and algorithms of an estimation of a cell's functional state. Kayira V.V.
Scientific adviser: Ph.D., c.t.s. assistant prof. V.G.Adamov
ABSTRACT
Table of contents
1. Introduction.
1.1 Urgency and motivation.
1.2 A existing developments survey.
1.2.1 LEICA Qwin.
1.2.2 Diamorph.
1.2.3 Hesperus.
1.2.4 Global automated image analysis.
2. Main part.
2.1 Theoretical analysis.
2.2 Shape analysis. Algorithm SUSAN.
2.3 Geometrical characteristics.
2.3.1 Fourier Descriptor.
2.3.2 Fractal dimension.
2.4 Texture analysis.
2.4.1 Methods of the texture analysis included in Hesperus.
2.4.2 Textural model based on two-dimensional spectrum of image
texture.
3. Final part.
3.1 Frequency characteristics of object. Results.
3.2 Conclusion.
1. Introduction.
1.1 Urgency and motivation.
The analysis of the image represents scientific area which deals with geometrical and densimetrical measurements on images, received from various sources. The main scope of similar measurements and calculations — the quantitative microscopy allowing quickly and precisely to receive statistically significant results and consequently superseding traditional and subjective qualitative methods. Examples of similar measurements can be definition of a volume fraction of various phases in alloys or in geological test, numerical and dimensional distribution of the polluting particles filtered from the air or liquid environment, or distribution of integrated optical density inside nucleus of the painted biological cells.
Now in laboratories and on manufacture there is a necessity of the digital pictures analysis containing the same objects, probably distinguished from each other in some parameters.
The decision of the given problem encounters the certain problems of realization existing developed methods of the analysis intended for single objects in a picture. New techniques of solving such problems and also possible procedures of the analysis of the received data are in the view.
Within the framework of a task, existing software products are observed.
1.2 A existing development survey.
For the first time the method of an image analysis has appeared as a mean ready to use in 1963 together with development QTM (QTM — the Quantitative Television Microscope), created by firm Metals Research Ltd., becoming subsequently a part of company "Leica". The specified device intended for use in metallurgical laboratories — especially for the quantitative control over cleanliness of steel and for other microstructural measurements, obvious utility of this device in other areas has soon become evident. One of its first applications in biology began measurement of the size of air spaces in lungs (that was required for the quantitative description of a lungs lesion level) and for calculation of grains amount of silver in an autoradiography.
Since then the advanced technics of an image analysis has found the application almost in all scientific and technical areas of natural sciences, from anatomy and zoology, and has expanded the abilities to including such functions of mathematical processing, as a filtration and amplification of images.
1.2.1 LEICA Qwin.
Now the most appreciable and significant program in the given field is the program of above mentioned firm "Leica" (Leica Imaging Systems Ltd.) – LEICA Qwin versions 1.56.
QWin is the set of applied programs of company "Leica" based on technical opportunities Windows for the analysis of the image. The given set is under the control of standard operational environment Microsoft Windows for the industrial purposes.
Program QWin allows to carry out measurements on several classes of accuracy, starting from measurement of objects in a dialogue manual mode up to the fully-automated analysis where as an example it is possible to result definition of inclusions in steel. As examples of use also it is possible to name such as:
· Measurement of length, distances up to object and the areas
· Percentage of a phase, the contents of fraction in the area and volume.
· Calibrating densitometry.
· Definition of the form of particles and the analysis of their sizes.
· Profiling of brightness levels.
However this program in practice has shown, that its work results have very big error. Qwin has very big scope, but with the decision of a concrete medical task of definition cells necrosis, and its smooth borders delineation of a living cell and sharp differences of the wrinkled membrane of cell that already died, this program consults badly since its methods are too "common" and do not take into account concrete conditions of shooting and cell.
1.2.2 Diamorph.
As example the medical computerized complex of the image analysis can serve "Diamorph", used in medical establishments and scientific institutes. Specialized complex "Diamorph" provide automatic input of microscopic images, allocation of objects of a picture (cells, nucleus, sites of different painting or brightness). The advanced toolkit for carrying out of measurements in a picture is provided: the linear sizes, perimeter, the area, optical parameters, position of objects. The statistical subsystem carries out mathematical processing results of measurements with automatic construction of a wide set of histograms, schedules, tables.
The complex software in an automatic mode provides the following functions of the quantitative and qualitative analysis of the image:
On group of objects: amount of objects, total perimeter, the total area, total integrated optical density.
On each object: perimeter, the area, the factor of the form, diameter of the circle equal on the area, the minimal diameter, the maximal diameter, sizes of projections to axes, coordinates of "the center of gravity", a corner between a direction of the maximal diameter and an absciss axis, color, average value of intensity and its dispersion, average optical density, average value optical transmission, integrated optical density.
Input and the specialized processing of roentgenograms, morphological images, smears with the purpose of increase of the diagnostic importance of researches, and also for archiving and conducting a database.
It is necessary to note, that this complex does not assess objects in functional sense, and gives only their parameters. Besides the entrance high quality image is necessary, that in real conditions is frequently very labour-consuming and it is not always possible. The texture analysis is absent.
1.2.3 Hesperus.
Let's consider program Hesperus intended for processing and visualization of two-dimensional sets of the numerical data of any nature. It is a product of Applied Mathematics Laboratory of the Moscow State University.
The package provides the big set of functions of processing, such as a filtration, a stretching and turn, the texture analysis, calculation of a spectrum, classification, etc.
From the mathematical point of view image processing and visualization of results is one of the best, however its applicability for so narrow problem is limited.
Lacks:
1) only the expert well understanding mathematics can give conclusions on calculated parameters;
2) there is no processing of groups of objects, such segmentation, that also complicates the analysis;
3) the complex is not automated, so all sequence of actions and the responsibility lays on the operator;
1.2.4 Global automated image analysis
Let's consider examples of other automated complexes.
Organization Global automated image analysis gives similar systems:
«Analysis of scleral collagen fibrils»,
«Analysis of the tear breakup in the human eye»,
«Automated Analysis of Ultrasonic Images of the Human Carotid Artery»,
and others.
On used methods are similar to complex "Diamorph", are only more narrowly specialized, that gives them advantage in the decision of typical problems.
2. Main part.
2.1 The theoretical analysis.
At the decision of problems(tasks) of such class generally use the following structure of diagnostic system:

Fig. 1 – Structure of the specialized computer system.
As the most authentic and exact technique of definition of parameters the method of construction of the generalized текстурно-planimetric model of objects on the image can serve. We shall consider the circuit of a subsystem of preliminary processing and allocation of researched parameters.
Fig. 2 – the Block diagram of a subsystem of preliminary processing and allocation of researched parameters.
In this system subsystems of preliminary processing and allocation of researched parameters and formations of the conclusions are difficultly sold.
At processing images a lot of information is concluded in contours of objects, but also the analysis of a structure is very important. On a texture of those or other sites of objects it is possible to make assumptions or even sometimes concrete conclusions. For the texture analysis are intended the block of construction of texture model. For construction of any texture model, preliminary it is required to break the analyzed image into sites with a homogeneous texture (make texture segmentation), and also, it is desirable to define the type of a texture.
2.2 Methods of the planimetric analysis. Algorithm Susan.
Basic idea SUSAN it that neighbours of each point in homogeneous area have brightness close to it, and near to border number of neighbours with identical brightness decreases. Except for borders this method finds out also other features on the image (corners, thin lines, etc.). This principle illustrates figure 3.
Around of each pixel of the image the mask is constructed which central pixel refers to as a nucleus (in work round mask with radius 3.4 pixels which includes 37 pixels or a traditional square mask 3x3). Pixels within the limits of a mask, having brightness comparable to a nucleus, form area USAN (Univalue Segment Assimilating Nucleus – a homogeneous segment, ассимилируемый a nucleus). For detection of bidimentional features and borders the size, the centre of gravity and second moments USAN are used. Such approach of detection of features differs from known methods that does not use derivatives of the image and, hence, there is no necessity for preliminary suppression of noise.
Fig. 3 – the Different masks imposed on the image;
Area USAN is maximal, when the nucleus is in homogeneous (or nearly so homogeneous) areas of the image, it decreases up to half of this maximum near to direct border and decreases even more near to a corner and reaches local minima precisely on border and in corners. This property of area USAN is used as the main criterion of presence of borders and two-dimentional features. In figure 4 are shown USAN, apparently, axis Z (area USAN) is directed aside reduction!
Fig. 4 – the Three-dimensional schedule, showing change USAN for a sample of the grey image.
Comparing SUSAN, for example, with one of most widely used Canny borders detector (association of gradient operators and Gauss smoothings) is possible to note the following features and differences:
- Algorithm Canny finds out unique border, i.e. on the image such as Т – crossed borders – it will select one way of a contour while SUSAN will find out a corner and even will allocate with its falling of area USAN.
- Algorithm Canny – because of use of a derivative smooths borders and corners (it certainly plus at a faltering contour since it will close it); At enough high quality of the processable image Susan can show ideally correctly all features of the form of object (objects!) images.
There are more differences, however it is enough of these to prefer the detector of borders SUSAN processing the image of a fabric (a layer of cells).
2.3 Geometrical characteristics.
2.3.1 Fourier Descriptor.
One of the most promising technique for the description of the form is based on Fourier descriptors for borders of the image. Let's assume, that N points are available on an area border. We can consider area as placed on a complex plane with ordinate as imaginary ordinate and absciss which is real absciss. Then, coordinates x-y each point of an analyzed contour can be submitted as complex numbers (x + jy). The sequence for borders then can be written down as complex sequence Zi:
Zi = Xi +j*Xi, i = 0,1,2, …, N-1,
where j – imaginary unit.
We receive Z = z(i).
Let's put, that z(i) – a continuous curve. The continuous curve is simple curve (Jordan arch) if it will consist of a uniform branch and does not contain multiple points; it means, that is not present such various j1 and j2 for which it is fair z(j1) = z(j2).
Also we shall put, that an arch is rectifiable(has a limit of length).
Complex planimetric integral:![]()
Then points z0, z1, …, zn are located one by one along a contour With.
Each of points xi lays on a site of a curve [zi-1, zi] and can coincide with one of its ends.
Then generally (for z = u (x, y) + j×v (x, y)): ![]() for
our valid argument
for
our valid argument
(u (x, y) = x (i) +0, v (x, y) = y (i) +0)), it is
received
![]()
![]() ,
,
Applying Fourier transformation, we close a contour on themselves, having made its period 2p.
![]()
![]() ,
,
c(v) – comlex coefficients of Fourier transfirmation.
Then in a discrete variant:
 (5)
(5)
i=0,1,2, … N-1
To coefficients for an analysis may be applied theorems (2.4.2).
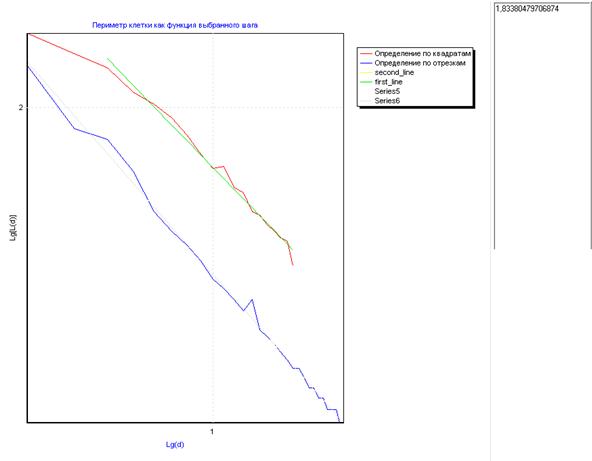
2.3.2 Fractal dimension.
Fractals meet everywhere where correct forms of Euclidean geometry come to an end. Everything, that is created by the person, limited to planes. If there is a natural object, at the first view it is visible that to describe its form with all roughnesses it is possible only approximately. Here fractals come to the aid.
According to Benua Mandelbrot, a word the fractal occurs from latin words fractus – fractional and frangere – to break, that reflects essence of a fractal as the "broken", irregular set and designates the set having fractional dimension. Mandelbrot has given strict mathematical definition of a fractal as sets, which Hausdorff dimension is strict more than topological dimension. However he has not been satisfied with this definition because it does not include some sets considered by many mathematicians as fractals. In the given work the variety of fractals and spheres of their appendix is not considered, therefore we shall consider only the basic concepts for definition of the form of object.
Hausdorff dimension (dimA) of set A is defined as:
 (6)
(6)
Box dimension is a little more simple concept. If A some compact set, and N (r) is the minimal number of spheres of radius r covering A and if there is a limit
lim (log N (r) / log (1/r)), (7)
at r aspiring to zero this limit refers to as cubic dimension of set A. It is known, that Hausdorff dimension does not surpass box dimension, and for self-similar fractals they are coincide.
Topological dimension, accepting exclusively the whole values, will be coordinated to intuitive representation about dimension of set. So dimension of one-dot set is equal to zero, a piece and a straight line – unit,... Dimension of a n-dimensional cube is equal n. More strictly:
Topological dimension of set A is equal to zero if for any point of set A there will be as much as small vicinity which border is not crossed with A;
Topological dimension A is equal n if for any point of this set there will be as much as small vicinity which border is crossed with A on set of dimension n-1, and besides n there is the least positive number for which this condition is executed.
2.4 The texture analysis.
2.4.1 The method of the texture analysis included in Hesperus
In Hesperus use both the histogram, and a matrix of spatial dependence (GLCM).
Matrix of spatial dependence (GLCM – gray level co-occurrence matrix) – the histogram of the second order showing probability of joint occurrence of two certain values pixels on the set distance and in a certain direction. The sizes of matrixes depend on quantity of gradation of color taken in consideration. In Hesperus matrixes in the size 256x256 elements that corresponds to 256 shades of grey color are applied. On the basis of a matrix of spatial dependence the big number of textural characteristics is calculated.
The structure can be allocated on the basis of various criteria. Application of any of these criteria to the image gives other image where intensity of every pixel reflects size of conformity to this particular criterion in a concrete point of the entrance image on an output. Results of the textural analysis are usually treated as one multichannel image, and can be sent on an input to the standard qualifier which groups structures on classes.
To apply a certain particular criterion, it is required to be set by a number of parameters. Usually it is the size of a window which is examined around of every pixel, and also a direction and displacement. Last two parameters are used for the analysis of structures which differ in various directions (for example, a brick wall where the distance between bricks is more in one direction, than in another).
Difficult methods for recognition of all areas with a similar texture can be necessary because of the criteria are sensitive to orientation of a texture in the image. For example, on the ploughed field the texture along furrows is distinct from a structure across furrows, hence two adjacent areas with furrows, focused under 90 degrees relatively each other, will not be classified as identical if the criterion dependent on orientation used for them.
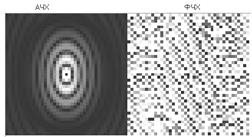
2.4.2 The textural model based on a two-dimensional spectrum of a structure.
Let's consider a method focused on frequency characteristics of a texture, which are invariant to rotation, displacement and partially scale.
A spectrum image is calculated by application to the image a discrete Fourier transformation. The result of transformation is the complex image. It is possible to define the main frequencies of the image on the amplitude spectrum, characteristics and dependences should be studied.
Coefficients of multi-dimensional Fourier transform (for our two-dimensional case):
 (8)
(8)
aj<tj<aj+Tj, j=1,2.
Such description of images possesses the essential advantages useful at recognition:
1. The module of spectral function: |F (u, v) | does not depend on displacement of function f (x, y), i.e. the description is invariant to displacements of the image in planes of supervision.
2. The description of images possesses the certain noise stability. When spectrum of recognizabl images and an additive handicap are various, it is possible to increase the attitude(relation) signal / noise with the help of a spatial filtration.
3. A rotation of the image around any point results in rotaion of spatial spectrum F (u, v) around the beginning of coordinates with respective alteration of phases making (change of phases does not influence on |F(u, v)|).
4. if the image f (x, y) has spectrum F (u, v), the image f (ax, ay), connected by transformation of similarity with f (x, y) where a – the constant factor, has a spectrum
The radial line in a frequency plane corresponds to an unique direction in the image which includes all frequency components. A set of sizes
 ,
(9)
,
(9)
characterizes all directions, if Qj (j=1,2..., n) cover sector from 0 up to 3600. In practice it is used a sample window of a wedge-like form. Such window defines the contribution from a small number of adjacent directions and possesses that advantage that reduces number of necessary excerpt and reduces influence of little changes. The set of sample windows of a wedge-like form allows to receive the description of a power spectrum along a radial direction. This method of digitization is not sensitive to scale of the image.
Fig. 6 – the Set of the optical windows used at processing of power spectrum
3. The conclusion.
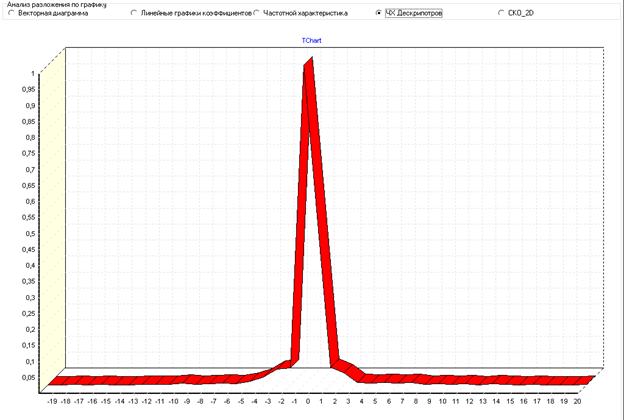
3.1 Frequency characteristics of object.

The one-dimensional frequency (power) characteristic of a contour.
Normalized Fourier descriptor of the contour.
Fractal dimension of the contour.
two-dimensional power spectrum and its characteristic.
3.2 A conclusion.
In the given work few possible(probable) characteristics of objects are resulted. The primary goal is their generalization and carrying out of statistical researches on real objects. Preliminary results (in work are not resulted) have shown good accuracy and reliability. The big field for development is the presence(finding) of the generalized characteristic of a bidimentional spectrum. Wide application in this sphere can find вей влеты with which help it is possible to consider more in detail frequency characteristics as objects and a structure.
Table of contents
1. Introduction.
1.1 Urgency and motivation.
1.2 A existing developments survey.
1.2.1 LEICA Qwin.
1.2.2 Diamorph.
1.2.3 Hesperus.
1.2.4 Global automated image analysis.
2. Main part.
2.1 Theoretical analysis.
2.2 Shape analysis. Algorithm SUSAN.
2.3 Geometrical characteristics.
2.3.1 Fourier Descriptor.
2.3.2 Fractal dimension.
2.4 Texture analysis.
2.4.1 Methods of the texture analysis included in Hesperus.
2.4.2 Textural model based on two-dimensional spectrum of image
texture.
3. Final part.
3.1 Frequency characteristics of object. Results.
3.2 Conclusion.
Literature
1. G.Korn, T.Korn. Mathematical handbook // M.: "Science", 1974, 831 with.
2. A user manual for program LEICA QWin.
3. A user manual for program Heperus.
4. V.V.Zhikov. Fractals. Mathematics 1996.
5. Smith and Brady. «SUSAN – A New Approach to Low Image Processing», 1995.
6. Sven Loncaric. A survey of shape analysis techniques.
7. Jenkins, WK. " Fourier Series, Founer Transforms, and theDFT " Digital
Signal Processing Handbook Ed. Vijay TO Madisetti and Douglas IN Williams
BocaRaton CRC Press LLC, 1999.