Agitator
(Ćóđíŕë ôčđěű Áđţëü č Ęúĺđ"The Monitoring System")
One particularly critical machine is the agitator in the main reactor of one the plants. Due to its importance to production, the agitator was chosen as one of the units to be monitored continuously. A sketch of the agitator is shown in Fig. 4.
In the past, breakdowns have occurred with considerable costs as a consequence (lost production, damage of machine parts etc.). Since the introduction of permanent vibration monitoring, however, no unexpected breakdowns have occurred. Also, in a number of cases, minor damage has been prevented from developing, possibly into potentially serious failure, as early vibration alarms have allowed appropriate action to be taken in good time.
Example 1
Shortly after installation of the permanent monitoring system, a Spike Energy alarm was registered from the transducer mounted on the seal/roller bearing assembly at the top of the mixing shaft. This bearing was not normally changed when overhauling the seal.
Fig. 5 shows the RMS and Peak trends, which give steady readings (the x-axis scale refers to the number of weeks before the trend curve was drawn). Fig. 6 shows the long term Spike Energy trend from this transducer. This can be seen to increase at the time when the fault was discovered (between approximately -16 and -14 weeks on the trend time-axis).
By listening to the channel, a "ticking" sound could be heard once per revolution. The automatic spectrum
comparison showed an increase at approximately 17 Hz. By calculating the relevant bearing frequencies, this 17 Hz increase was diagnosed as a discrete bearing fault, which appeared to be at a very early stage in its development. A work order for changing the bearing was then made for the next planned production stop. During the period up to the planned stoppage the fault was closely followed, during which time the 17 Hz component showed a slight increase.
At the planned production stop, the bearing and seal were replaced. On inspection of the bearing it was seen that there was a single spall in the outer race of the bearing, see Fig. 8. The fault was at such an early stage that it was estimated that the bearing could have run for a further 6 months without problem.
After a new seal/bearing assembly was mounted, the condition was checked in the usual manner. The RMS and Peak levels were steady, but the Spike Energy level (see Fig. 7) showed a very random spread and, by listening to the seal, a noise could be heared that was completely random. The reason for this noise, however, could not be traced, but was assumed to come from rubbing between two parts.
Normally, in such a situation, the agitator would be shut down and the seal replaced. However, after closely studying the vibrations levels for 1 day, a decision was made not to stop and change the seal, but to continue production and use the trending to check condition. In Fig. 6 can be seen the result of this patience, as the trend curve shows that the Spike Energy level dropped to a normal level shortly after (approximately between weeks -11,5 and -11 on the trend time axis). At this time the rubbing sound also disappeared.
Had the monitoring system with its trend analysis function not been employed, then an unnecessary production stop would have been carried out, with all the detrimental costs of lost production, increased maintenance etc.
Example 2
On a later occasion, during repairs on another machine in the production line, the seal/bearing assembly just above the agitator tank was changed as part of the plant's preventive maintenance programme. Shortly after production start-up, several alarms were registered from this bearing at the same measuring point as in example 1.
The automatic spectrum comparison showed a significant increase in vibration level in the 1-10 kHz region. This continued to develop over the relatively short time of just a few hours, see Fig. 9.
The problem was at first assumed to be associated with poor bearing lubrication. Grease was subsequently pumped into the bearing and the abnormal vibration levels were seen to drop to a normal level. However, after a few minutes the high frequency vibration returned and continued to increase.
This high frequency increase indicated classic symptoms of a damaged bearing and it was decided to stop production and inspect the bearing. On inspection it was found that the rollers were deformed, see Fig. 10, and on further investigation it was discovered that the bearing had in fact been mounted without grease. This very early stage damage, however, could clearly be seen in the spectra. The bearing was subsequently replaced and production restarted. The vibration thereafter dropped to a normal level over the whole spectrum.
It is very likely that a serious breakdown was prevented. The on-line spec-
trum comparison gave an alarm in good time before a serious problem occurred, even though the fault developed very quickly. At the same time, the spectrum comparison gave sufficient information about the fault to enable its cause to be effectively diagnosed.
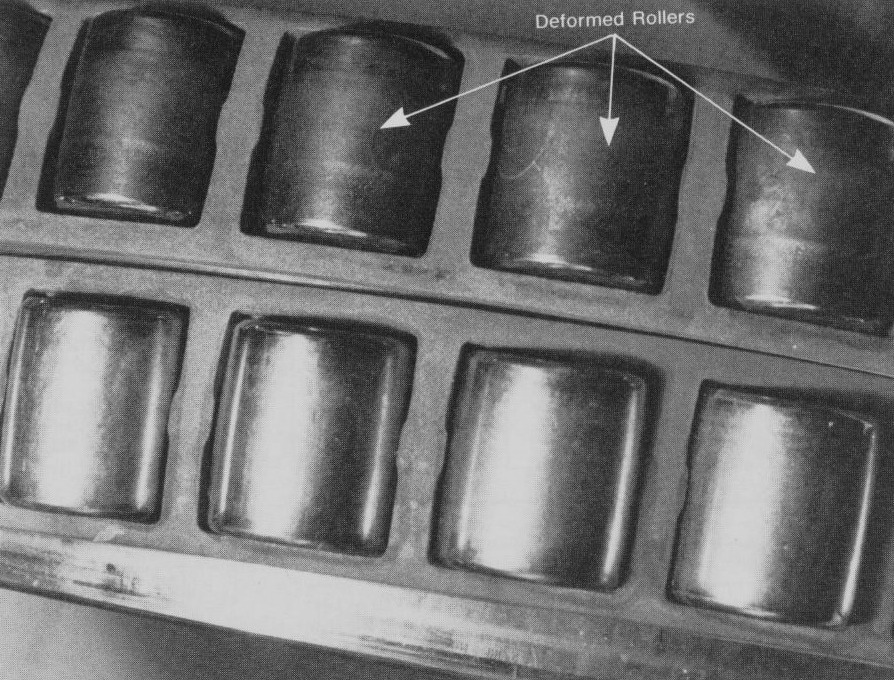
Fig.10. Deformation of the bearing rollers
Minor Changes Detected
Besides these two incidents, where major damage was clearly prevented, there is an added benefit from the system. Any changes in the frequency spectrum above a pre-defined tolerance, no matter how insignificant they may at first appear, are automatically reported and stored. In this way, minor changes in condition can be followed and, together with information from other machines in the same production line, decisions can be taken well in advance about when to overhaul the machine. So, unless there is an indication of serious deterioration in condition, the machine can be kept in production for maximum time.
Advantages of Spectrum Comparison over Broadband Monitoring
For this type of detailed condition monitoring, the use of spectrum comparison is absolutely vital. The broadband monitoring of RMS, Peak and Spike Energy will certainly react if there is a serious immediate threat, but small changes in low energy components in the vibration spectra are not reflected in these parameters.
This is shown in an example were only a minor change in condition was
detected, this time using measurements made on the gearbox of the agitator. The broadband values were seen to be stable on all measurement points on the gearbox (the Spike Energy and RMS trends are shown in Fig. 11). However, studying the stored narrowband spectra revealed a positive trend in the 3-10 kHz range (see Fig. 12), plus some small increases in low frequency components (see Fig. 13). This suggests the beginning of deterioration of the gearbox bearings.
As these changes, however, were not considered dramatic, the agitator was kept running. A close check on the levels will be kept as the monitoring continues, and if the changes continue to develop, this will be reported by the system.
Another example of such a minor change can again be shown on the agitator, this time on the motor. Fig. 14
shows a spectrum comparison from the motor, which indicated some high frequency components beginning to increase. The trend curve in Fig. 15 shows the beginning of an upward trend in the 1,6 kHz to 1,8 kHz frequency range. The most likey cause of these increases was deemed to be from a bearing problem in its early stages. However, as the increases in level were not considered serious, the bearings were lubricated regularly to keep the levels down and the motor was run until the next scheduled shut-down. At this shut-down, the motor's bearings were examined and, on one of them, traces of pitting were found on the outer race.