| Rus Ukr Eng | ABSTRACT |
Speciality: Land surveying and cadastre

Abdallah Rang A
Theme of master's work:
Digital Map Updating Using Satellite Data and DGPS Techniques
Scientific adviser: Professor, Doctor of Technical Science, C.G.Mogilnyy
Introduction
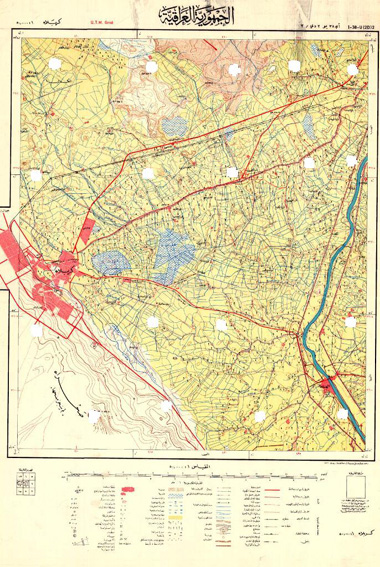
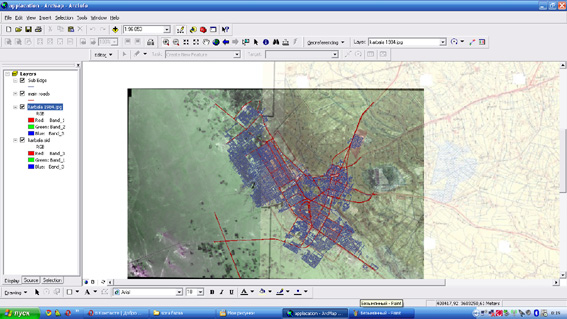
In this work a detailed explanation about the updating of old maps has been introduced using the integration between remote sensing (R.S), Differential Global Positioning System (DGPS) and Geographical Information System (GIS). especially in countries of large areas such as Iraq, there are thousands of maps that have not been updated for along time or tens of years despite the fact that these maps are considered a wealth of information that cannot be left out . At the same time we cannot depend on these maps because they do not represent the real situation on land due to the changes that happened to them . Therefore , the idea of this thesis came to find an accurate , practical , quick and economical procedure to update maps by the use of remote sensing informations. In addition all the necessary requirements and resources are provided to make the updating process in the study area in Kerbala city on a map with a scale of 1:50000 which has been updated last in 1984 .
The updating achieved on three stages:
1-Field survey stage : A stage of field survey started with a wide discovery of all parts of the study area and choosing the clear features in the satellite image to be as a Ground Control Points (GCP) used later in the geometric correction for the image . The observations are achieved by using the highly accurate (DGPS) model (Trimble) which started by observing the base point and the (RMS) in observing this point was (0.011m) . Then observation of the (GCP) is achieved at 16 points in all parts of the study area and the error was from (0.004) to (0.018m) . To make the transformation between the image datum and the map datum , we have observed some of the horizontal control points using the world wide (WGS84) system . Since these points have coordinates values in the old system of Iraq (Clarck) ,seven parameters of datum transformation have been calculated using equations of datum transformation. The last observation in this stage was to observe 30 points separated over study area. Each of these points represents a clear feature such as building corner or crossroad to be used in the evaluation of resulted maps accuracy.
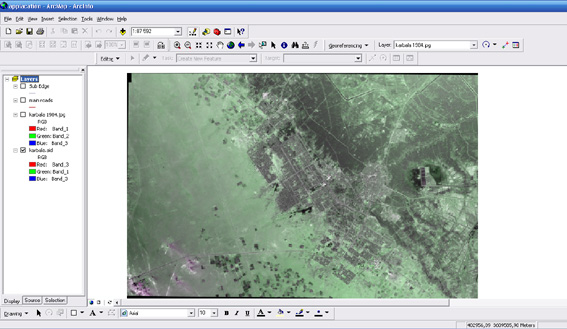
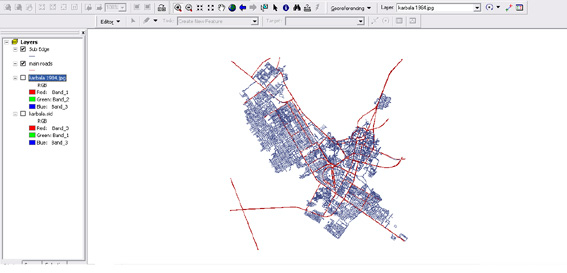
2-Digital processing of image and map: this stage include the satellite image and map digital processing within several steps: the first is the image geometric correction by (ArcGis 9) and the RMSE was 1.5m, second step is the geometric correction of map by (Autodesk land desktop 2006) which has a quick and automatic procedure for correcting maps by using the grid of map and the total error in this operation was (5.2m). After unification for coordinates systems of image and map, the process of getting information from them began using the supervised classification in (ERDAS Imagine 8.4), where these information is separated into layers. To detect the change that occurred in the map, change detection process is used by (ArcGis 9) through comparing each layer extracted from image with its counterpart in the map and studying the expansion in Kerbala city and the change happened to the roads and canals network.
3-Producing of maps: this stage contains two parts: the first part is the producing of digital maps compatible with GIS. The second part includes evaluation of the produced maps accuracy where the total RMSE was (12m) which is completely convenient with the map scale of 1:50000.
Relevance
Technological progress does not stand still,there are many new technologies in this field of study , improved programs used for data processing and provide more accurate and detailed maps for large and remote areas. Relevance is directly connected with the very material of the study, its specificity.
Science merit
The scientific merit is to update the data and create accurate modern map for the region under study. Inadequate study of this issue requires new data, structuring information. These results help to find the precise, practical, fast and economical way to update maps, using remote sensing.
Practical value
The practical value of this research is the ability to use this experience to compile digital maps for any region.
Summary
Why have we chosen the city of Kerbala as the study area?
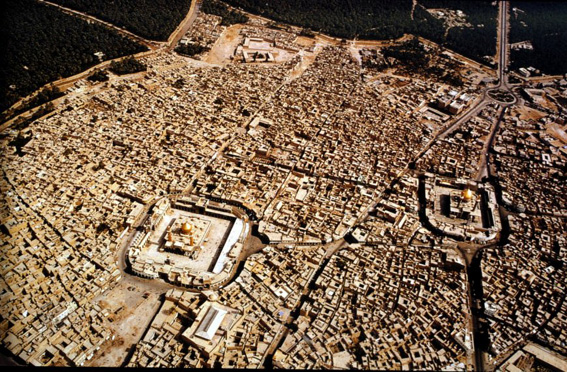
There are several reasons for that. Firstly, the variety of land covers and land use, water, agriculture, buildings and roads. Secondly, Kerbala city considered to be of historic and civilian value so the city is witnessing campaign for reconstruction in all sectors. Thirdly, existence of raw data such as satellite images and topographic maps. And the last argument, the resulted maps of this work especially the updated maps could be useful to current projects.
The need for topographic maps is very important and of interest to many research centers because specialists and planners and the decision-makers in the public sector need to update topographic maps for the planning of the establishment of a network of transportation routes and other quick highways , for the development and protection of natural resources , environmental control and as well as for the tourism sector .The problem faced by professionals is how to update topographic maps in large countries in terms of area or states that evolve quickly because they need a lot of time, effort and money. Iraq is one of those countries, particularly which about 95% of topographic maps with scale 1:25,000, 1:50,000 and 1:100,000 are not updated and if found then to limited areas.
The objective of the modernization of the maps is to add new changes in the region in order to help planners in their work, [8]. Of course, continuously updated through regular methods is an impossible task requiring great sources of information and so also in the use of modern mapping in developed nations, many of the developing nations feel concerned with how to cover their topographic maps. With scientific progress updating maps has become a priority and very important, so all techniques were used to updating maps are changed.
Regular methods were used before to updating maps and the situation requires time and money therefore the idea of using remote sensing and DGPS in updating maps is came. With the available satellite images, many Agencies and Councils attempted to use this technique in updating topographic maps, and have begun using satellite multispectral and multi-resolution images over the last years [13]. Integration between remote sensing, DGPS and GIS can help updating maps at low cost and with accuracy. Since the successful launch of IKONOS in 1999, a new source of imagery has been available to the civilian spatial-data user. In many parts of the world high resolution satellite imagery from IKONOS, has proved to be a useful data source for the creation of orthorectified images and associated mapping products. One of the great advantages of satellite imagery is the ease of access to areas which have previously been too remote or too dangerous to reach using conventional aerial photography. However, for areas of the Earth which are not difficult to reach, and which have a tradition of high resolution mapping from aerial photography, this advantage is of rather limited importance. Updating old topographic line maps has always been a headache for cartographers when using analogy processes. Nowadays, using both the flexibility of digital processing added to the repetitively of earth observation satellites, map updating could be carried out quickly and efficiently. The purpose of the this work is to describe the different steps of the digital map updating process using satellite imagery, Differential Global Positioning System (DGPS) and Geographical Information System (GIS).
The process of updating the maps is a difficult process and requires time and effort, compared with the use of traditional methods. But when using techniques of remote sensing, DGPS and GIS, effort gets less expensive and more accurate. Interest in the use of Global Positioning System has been developed over a decade ago. In recent years, this interest has grown considerably, sparked primarily by the general improvements in satellite/receiver technology, advances in GPS data processing techniques and the deployment of the full constellation of 24 satellites. Improvements in satellite/receiver technology enable more precise determination of three dimensional positions while the full constellation provides enough satellites for sufficient geometry 24 hours a day around the globe. This has dispelled the initial uncertainties of depending on the Global Positioning System as a fulltime practical tool, and has thus made it very attractive to use in mapping applications. The use of GPS as a high precision positioning technique is no longer debatable. High accuracies are achievable with GPS in either static or kinematics mode. With current powerful processing algorithms, which drastically reduce data collection and processing times, there is virtually no distinction between the two techniques. GPS observations provide the relative geometric positions for receivers simultaneously observing the same satellites. The determination is facilitated by the availability of many (more than four) satellites in the view window. GPS requires observations from at least four satellites and multiple receivers to determine positions accurately in static mode, while at least five satellites are required in kinematics mode. With the present constellation of 24 GPS satellites deployed around the globe, the required number of simultaneously observed satellites is easily met. The availability of GLONASS satellites and current research into combination of GPS with GLONASS can only help the situation. Two types of observables are made in GPS positioning - pseudorange and carrier phase. The pseudorange is the distance between the satellite and the receiver and is measured in terms of the travel time of signal code (C/A code or P-code) from the satellite to the receiver. The carrier phase is the difference between the received phase from the satellite and the phase of receiver oscillator at the epoch of measurement. The time measurements are indirectly obtained from these phase measurements using two carrier frequencies L1 (1575.42 MHz) and L2 (1227.60 MHz). Not only should the receiver view the required number of satellites, but also their geometric constellation described by DOP-factors (Dilution of Precision) should be suitable. The smaller the PDOP (positional dilution of precision) value, the better the geometric constellation. GPS measurements can also be affected by other errors such as cycle slips and multi-path effects, which can degrade positional accuracy. Today most of these errors are considered manageable for most survey operations. The high accuracy of GPS lies in its differential positioning. In the single point positioning for determining the geocentric position of a receiver, accuracy is in the meter range. But operated in a differential mode, GPS provides very accurate position and velocity information when the carrier phase observable is used. Accuracies at the centimeter level are typical.
GPS coordinates are always directly referenced to an Earth-centered, Earth-fixed (ECEF) Cartesian system, and can be easily converted to latitude, longitude and ellipsoidal height [9]. Map production or modification is carried out with reference to some projection system such as UTM, or a local grid system. Vertical control (orthometric height), which is referenced to the geoid, deviates from the GPS derived ellipsoidal height. It is necessary that careful attention be taken to properly convert ellipsoidal heights into orthometric equivalents based on knowledge of the local geoidal undulations. The vertical accuracy then depends on the availability and accuracy of the geoidal model used. In the application of GPS in mapping any of these problems can frustrate the whole process, and thus it requires strict quality control measures to conduct and achieve a successful mission. With improvements in current receivers and efficient processing techniques, most of the factors that precipitate these problems can be controlled, minimized or avoided. These problems and expansions upon current solutions will be further addressed in this research.The need for very accurate epoch solutions are important because any errors in the individual epochs themselves will propagate into the control points which will be used to georeference and orthorectify of satellite imagery.
Now, it’s high time to pay attention to the problem of Errors in GPS.
Up to now we have been treating the calculations that go into GPS very abstractly, as if the whole thing were happening in a vacuum. But in the real world there are lots of things that can happen to a GPS signal that will make its life less than mathematically perfect. To get the most out of the system, a good GPS receiver needs to take a wide variety of possible errors into account. Here is what they have got to deal with. First, one of the basic assumptions we have been using throughout this study is not exactly true.The user calculates distance to a satellite by multiplying a signal's travel time by the speed of light. But the speed of light is only constant in a vacuum. As a GPS signal passes through the charged particles of the ionosphere and then through the water vapor in the troposphere it gets slowed down a bit, and this creates the same kind of error as bad clocks. There are a couple of ways to minimize this kind of error. For one thing we can predict what a typical delay might be on a typical day. This is called modeling and it helps but, of course, atmospheric conditions are rarely exactly typical. Another way to get a handle on these atmosphere-induced errors is to compare the relative speeds of two different signals. This "dual frequency" measurement is a very sophisticated and is only possible with advanced receivers.
Trouble for the GPS signal doesn't end when it gets down to the ground. The signal may bounce off various local obstructions before it gets to our receiver. This is called multi-path error and is similar to the ghosting we might see on a TV. Good receivers use sophisticated signal rejection techniques to minimize this problem. The whole concept of GPS relies on the idea that a GPS signal flies straight from the satellite to the receiver. Unfortunately, in the real world the signal will also bounce around on just about everything in the local environment and get to the receiver that way too. The result is a barrage of signals arriving at the receiver: first the direct one, then a bunch of delayed reflected ones. This creates a messy signal. If the bounced signals are strong enough they can confuse the receiver and cause erroneous measurements. Sophisticated receivers use a variety of signal processing tricks to make sure that they only consider the earliest arriving signals (which are the direct ones). Even though the satellites are very sophisticated they do account for some tiny errors in the system. The atomic clocks they use are very, very precise but they're not perfect. Minute discrepancies can occur, and these are translate into travel time measurement errors. And even though the satellites positions are constantly monitored, they can't be watched every second. So slight position or "ephemeris" errors can sneak in between monitoring times. Ephemeris (or orbital) data is constantly being transmitted by the satellites. Receivers maintain an "almanac" of this data for all satellites and they update these almanacs as new data comes in. Typically, ephemeris data is updated hourly. Differential GPS can eliminate almost all error. Basic geometry itself can magnify these other errors with a principle called "Geometric Dilution of Precision" or GDOP. It sounds complicated but the principle is quite simple. There are usually more satellites available than a receiver needs to fix a position, so the receiver picks a few and ignores the rest. If it picks satellites that are close together in the sky the intersecting circles that define a position will cross at very shallow angles. That increases the grey area or error margin around a position. If it picks satellites that are widely separated the circles intersect at almost right angles and that minimizes the error region. Good receivers determine which satellites will give the lowest GDOP.
The next interesting question to be discussed: Differential GPS – what does it mean?
In order to achieve on-line positioning with high accuracies, Differential GPS (DGPS) is used. Differential positioning uses the point position derived from satellite signals and applies correction to that position. These corrections, difference of determined position and the known position, are generated by a reference receiver, whose position is known and is fed to the instrument, and is used by the second receiver to correct its internally generated position. This is known as Differential GPS.
How does it work?
The principal of DGPS is simple. If two receivers are placed close to one another, around 100-200 km they will be subject to the same amount of errors and travel through the same atmospheric conditions. So one uses 2 receivers- one at a known point (base) while the other receiver is collecting the data in the field (rover). The base receiver at the known point stores the position data in the memory or on a PC, while the rover stores the data from the field in its onboard or external memory. The computer compares the second by second data from GPS unit at the base with the actual known point data at the base station and determines the amount of error. When the data from the rover is downloaded in the PC, the software applies the corrections to the rover data and corrects the rover readings. This method is called the post processing method which is used in field measurements of this study. This method, while providing good accuracy has some limitations and disadvantages:
1- One needs 2 receivers (thereby raising the cost) or access to some base station data from a location within 200 km from the rover.
2- This method also does not provide real time navigation capabilities.
3- Frequently, if the satellites tracked by the base and rover units are different, the readings will not be corrected.
4- The other factor to consider in this method is the fact that for every hour spent in the field to collect the data, one needs to spend about an hour in the office post processing this data.
One more question that we can’t help discuss is code ranging. The Code ranging is the method of determining how much time it takes the signals to travel from satellites to receivers. With the travel times known, the corresponding distances to the satellites can then be calculated by applying the corresponding equation. With one satellite distance known, the range from its position would produce a sphere upon which the receiver lies. If the range is determined from two satellites, the result would be two intersecting spheres. the intersection of two spheres is a circle. Thus, two ranges from two satellites would place the somewhere on this circle. Now if the range for a third satellite is added, this range would add an additional sphere which when intersected with one of the tow spheres would produce another circle of intersection. The intersection of two circles would leave only two possible locations for the position of the receiver. Using a "seed position" that is within a few hundred kilometers of the position of the receiver will quickly eliminate one of these two intersections.
However in order to obtain a valid time measurement, the systematic error (known as bias) in the clocks, and the refraction of the wave as it passes the earth's atmosphere, must also be considered. In this example, the receiver bias is the same for all three ranges since the same receiver is measuring each range. With the introduction of a fourth satellite range, the receiver clock bias can be mathematically determined. This solution procedure allows the receiver to have a less accurate (and less expensive) clock. In addition we should point out that there are several additional sources of error that affect the satellite's signals. Because of the clock biases and other sources of error, the observed range from the satellite to receiver is not the true range, and thus it is called a pseudorange.
Refraction may greatly influence on accuracy of our measuring. As is known, the velocities of electromagnetic waves change as they pass through media with different refractive indexes. The atmosphere is generally subdivided into regions. The sub regions of the atmosphere that have similar composition and properties are known as spheres. The boundary layers between the spheres are called pauses. The two spheres that have the greatest effect on GPS signals are the troposphere and ionosphere. The troposphere is the lowest part of the atmosphere, and is generally considered to exist up to 10-12 km in altitude. The tropopause separates the troposphere from the stratosphere. The stratosphere goes up to about 50 km. The combined refraction in the stratosphere tropopause and troposphere is known as troposphere refraction. There are several other layers of atmosphere above 50 km. but the one of most interest in GPS work is the ionosphere which extends from 50-1500 k above the earth. As GPS signals pass through the ionosphere and troposphere, the signals are refracted. This produces range errors similar to timing errors, and is one of the reasons why measured ranges are referred to as pseudoranges. The ionosphere is primarily composed of ions-positively charge atoms and molecules, and free negatively charged electrons. The free electrons affect the propagation of electromagnetic waves. The number of ions at any given time in the ionosphere is dependent on the sun's ultraviolet radiation. Solar flare can dramatically increase the number of ions in the ionosphere, and thus can be reason for concern when working with GPS during periods of high sunspot activity which follows a periodic variation of 11 years. The advantage in having the satellites at approximately 20,200 km above the earth is that signals from one satellite going to two different receivers pass through nearly the same atmosphere. Thus the atmosphere has similar effects on the signals and its affects can be practically eliminated using mathematical techniques.
Real-Time Kinematic GPS Methode – what does it mean?
Methods similar to DGPS can also be employed with carrier phase-shift measurements to eliminate errors. The procedure, called Real-Time Kinematical (RTK) GPS surveying, again requires the simultaneous use of two or more receivers. Signals must be simultaneously collected by all receivers from at least four of the same satellites through the entire measurement process. Although single frequency receivers can be used, RTK GPS surveying works best with dual frequency receivers. The method yields positions accurate to within a few centimeters, which makes it suitable for most surveying, mapping, and stakeout purposes. As with DGPS the fact that the base station's coordinates are known is exploited in an RTK survey to compute pseudorange corrections (PRC). Once the pseudorange corrections are determined, they are used at the roving receivers to correct their pseudoranges.
Push broom Sensor
The push broom sensor is based on the use of charge-coupled devices (CCDs) for measuring the electromagnetic energy. A CCD-array is a line of photo-sensitive, solid state detectors. A single element can be as small as 5 um. Today, two-dimensional CCD-arrays are used in digital cameras and video re-corders. The CCD-arrays used in remote sensing are more sensitive and have larger dimensions. The first satellite sensor using this technology was SPOT-1. HRV. High resolution sensors such as IKONOS and Orb View-3 also apply the push broom principle. The push broom sensor records one entire line at a time. The principal advantage over the whiskbroom scanner is that each position (pixel) in the line has its own detector. This enables a longer period of measurement over a certain area, resulting in less noise and a relatively stable geometry. Since the CCD-array builds up images by scanning entire lines along the direction of motion of the platform, the push broom sensor is also referred to as along-track scanner. In push broom sensors there is no need for a scanning mirror, and therefore they have a higher reliability and a longer life expectancy than whiskbroom scanners. Because of this, together with the excellent geometrical properties, push broom sensors are used extensively in satellite remote sensing.
Geometric Characteristics of a Push broom
For each single line, push broom sensors have a geometry similar to that of aerial photos, which have a central projection. Because of the central projection, images from push broom sensors exhibit less geometric distortions than images from whiskbroom scanners. In the case of flat terrain, and a limited total field of view (FOV), the scale is the same over the line, resulting in equally spaced pixels. The concept of IFOV cannot be applied to push broom sensors. Most push broom sensors have the ability for off-nadir viewing. In such a situation, the scanner can be pointed towards areas left or right of the orbit track (across-track), or fore or aft (along-track). This characteristic has a number of advantages. Firstly, it can be used to observe areas that are not at nadir of the satellite, which reduces the time between successive observations (revisit time). Secondly, it can be used to image an area that is not covered by clouds at that particular moment. And lastly, off-nadir viewing is used to produce stereo im¬ages, [17]. The production of a stereo image pair using across-track stereo viewing needs a second image taken from a different track. When using along-track stereo viewing, the second image can be taken in quick succession of the first image by the same sensor along the same track. This means that the images are taken at almost the same time and under the same conditions, such as season, weather, and plant phonology. When applying off-nadir viewing, similar to oblique photography, the scale in an image varies and should be corrected for. As with whiskbroom scanners, integration over time takes place in push-broom sensors. Consider a moving platform with a push broom sensor. Each element of the CCD-array measures the energy related to a small area below the platform. At 10m spatial resolution and 6.5 km/s ground speed, every 1.5 mil¬lisecond (10m /6.5 km/s) the recorded energy (W) is measured to determine the DN-values for all the pixels along the line.
High Resolution Systems Ikonos
Ikonos was the first commercial high resolution satellite to be placed into orbit. Ikonos is owned by Space imaging, a USA-based Earth observation com¬pany. The other commercial high resolution satellites are Orb View-3 (launched in 2003, owned by Orblmage), Quickbird (launched in 2001, owned by Earth-Watch), and EROS-A1 (launched in 2000, owned by West Indian Space). Ikonos was launched in September 1999 and regular data ordering has been taking place since March 2000 [ 18 ]. The OSA sensor onboard Ikonos (Table 2 .2) is based on the pushbroom principle and can simultaneously take panchromatic and multispectral images. In addition to the high spatial resolution of 1 m panchromatic and 4 m multispectral, it also has a high radiometric resolution using 11-bit quantization. It is expected that, in the long term, 50% of the aerial photography will be replaced by high resolution imagery from space, and that digital airborne cameras will largely replace the remaining aerial photography. One of the first tasks of Ikonos was to acquire imagery of all major USA cities. Previously, the mapping and monitoring of urban areas from space, not only in America, was possible only to a limited extent. Ikonos data can be used for small to medium scale topographic mapping, not only to produce new maps, but also to update existing topographic maps which thepurpose of this thesis.
Литература
- C.Armenakis, CHANGE DETECTION METHODS FOR THE REVISION OF TOPOGRAPHIC DATABASES, Center for Topographic Information, Geometrics Canada, Natural Resources Canada.
- Christopher Joseph Pal, A Probabilistic Approach to Image Feature Extraction, Segmentation and Interpretation, M.Sc., Thesis, University of Waterloo.
- David Holland, Paul Marshall, UPDATING MAPS IN A WELL-MAPPED COUNTRY USING HIGH RESOLUTION SATELLITE IMAGERY, Ordnance Survey, Romsey Road, Southampton.
- . Ehab NABIL NASSIF, A Unified System of Transformation Parameters for Combining Different Geodetic Networks in Egypt.
- Floyd F. Sabins (2000), REMOT SENSING PRICIPLES AND INTERPRETATION, university of California.
- ITC Educational Textbooks Series (2004), Principles of Geographic Information System.
- J.Grodecki and G.Dial, IKONOS GEOMETRIC ACCURACY.
- . Manon Carignan and Guy Dumoulin, TOPOGRAPHIC MAPPING AT THE 1:100,000 SCALE, bureau E-304, Charlesbourg.
- Michael Kostiuk, MA Geography, USING REMOTE SENSING DATA TO DETECT SEA LEVEL CHANGE, Ontario, Canada.
- Mohamed H.D, Use of Satellite Imagery for Digital Map Production & Revision, Mcs. Thesis, 1999. University of Baghdad.
- R. Thomas, DIGITAL MAP UPDATING FROM SATELLITE IMAGERY, Ramonville Saint Agne Cedex, France(2005).
- Dr. Richard A. Snay and Dr. Tom?s Soler, Modern Terrestrial Reference Systems PART 3: WGS 84 and ITRS, PROFESSIONAL SURVEYOR March 2000.