
Abstract
Content
- Introduction
- 1 Theme urgency
- 2 Analysis of the electrolysis process as a control object
- 3 The purpose and objectives of the research
- 4 Modeling of ACS and analysis of the quality of regulation
- Conclusion
- References
Introduction
Currently chlorine commercially obtained together with sodium hydroxide and hydrogen by the electrolysis of sodium chloride solution. It is used three variants of the electrochemical method of producing chlorine. Two of them with a solid cathode electrolysis: diaphragm and membrane methods, the third – electrolysis with liquid mercury cathode (mercury production method).
In a diaphragm electrolysis cleared of impurities and saturated by NaCl brine is fed directly into the cell. In this case brine purification from the impurities is carried out at a pH of the brine in the range of 9–11 units, and the recommended pH of the brine before feeding to the electrolyzers should be 2.5–3.0 units.
In the mercury electrolysis, solution of NaCl (anolyte) leaving the cell, before returning it to the electrolysis stage, passes dechlorination, additional saturation with NaCl and filtered. Just as in a diaphragm method of brine purification is carried out impurities from brine at pH in the range of 9–11 units, and the recommended pH of the brine before feeding to the the electrolyzers should be 2.5–3.0 units.
Thus, in the production of chlorine and caustic soda is necessary to provide automatic control of the pH of aqueous solutions of NaCl (anolyte and brine) in the stages of its preparation and feed directly to electrolysis.
1 Theme urgency
In the production of chlorine and caustic soda is necessary to provide automatic control of pH of aqueous solutions of NaCl (anolyte and brine) to the stages of its preparation and submission directly to the electrolysis. Changing the pH of the brine is carried out by changing the acid costs (alkali) supplied to the respective process units. As a rule, the acidification of anolyte and brine, and anolyte alkalizing units as well as the processes of neutralization of wastewater, are the same type of objects of regulation. Typical schemes of these components are shown in Figure 1.1 a, b.
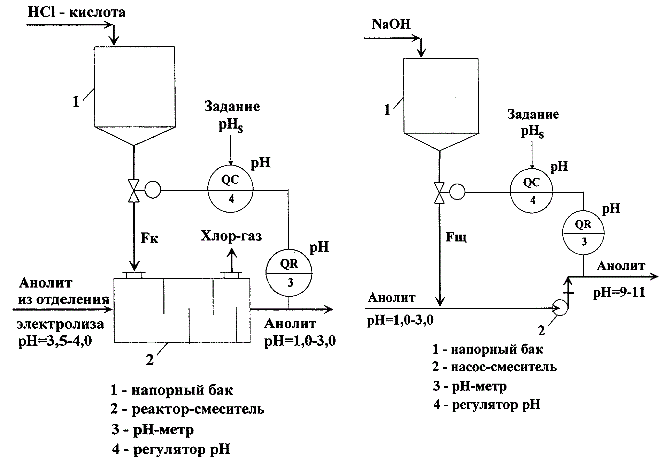
Figure 1.1 – A method for automatically adjusting the pH of the aqueous solutions: a) ACS unit of acidification of anolyte (left); b) ACS unit of alkalizing anolyte (right)
Units include tanks – tanks of acid or base (position 1 in Figure 1.1 a, b) providing a continuous supply of the reactants in the reactors of mixer. Special devices(item 2, Figure 1.1 a) can be used in the role of mixers , and, for example, efflux pumps (item 2, Figure 1.1 b). Automatic control system (ACS) of these units are also similar. As a control variable we are using the value of ph, which is measured on-site with the help of ph-meter (pos.3, Figure 1.1 b), controlled variable and task are send in the input of regulator of ph value (pos.4, Figure 1.1 b), and the regulatory impacts are acid flow rate (Fк) or alkali (Fщ).
Under the terms of reference for the process control systems of pH are presented fairly stringent requirements on the accuracy of maintaining the pH value. Typically, this value is ±(0.10–0.15) pH units. However, the existing automatic control system can not provide the required accuracy of maintaining the pH value and, moreover, often work in the self-oscillation mode unacceptably large amplitude.
Poor quality of adjusting the pH value is associated with sharply nonlinear nature of dependence of the ph value on the concentration of the acid or alkali solution [1]. When the activity of hydrogen ions or hydroxyl ions, equal to one, this dependence is described by the expression:
| pH = -lgCHCl, | (1.1) |
where – CHCl – concentration of acid in brine, mol/litre
| pH = 14+lgCNaOH, | (1.2) |
where – CNaOH – concentration of alkali in brine, mol/litre.
This dependence is shown in Figure 1.2, where in order to combine these two graphs in one figure, the acid concentration accepted as negative.
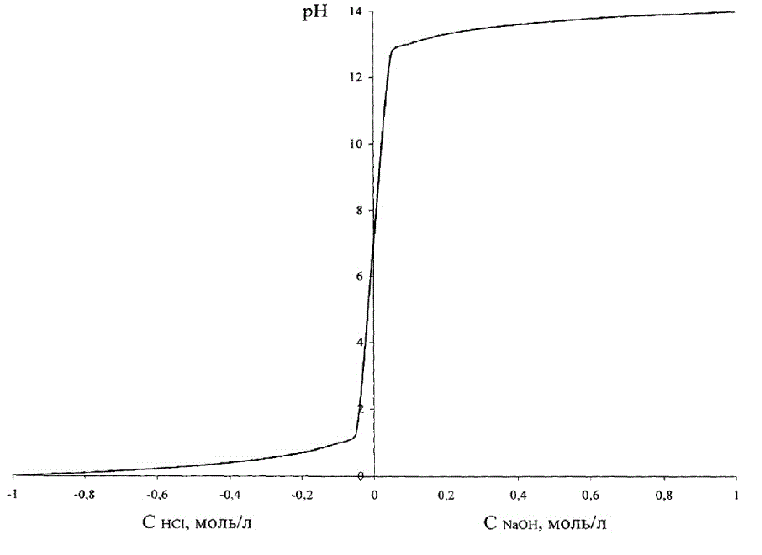
Figure 1.2 – Dependence of рН of brine on the acid (alkali)
Figure 1.2 shows that change of the pH in case of change of the concentration of acid – alkali is S-shaped curve with a saturation that is symmetric about a neutral environment, corresponding pH = 7.0 units.
Note that the entire range of values of pH = 0–14 corresponds to a very small absolute values of concentrations of acid/alkali.
Therefore, technological requirements, for example, to maintain the pH of the brine, equal to 2–3 units, correspond with the requirement to maintain the concentration of acid in the solution in range (0.04–0.36) g/L, so we must provide very high absolute accuracy of regulation of small values of concentration of acid [2]. The same dependence is true for alkaline solutions.
Since the flow of acid or alkali are several orders of magnitude less than the flow of brine or anolyte, the anolyte concentration or alkali in the flow is linearly dependent on the control action – flow rate of acid or alkali. Consequently, the same non-linear nature peculiar to the dependence of the ph value on the control action – flow rate of acid or alkali, which determines the low quality of pH-adjusting processes.
Also, if you analyze the generalized problem of pH control, the known method of improving the stability and quality control of pH is by using two control valves of different sizes to compensate for non-linearity characteristics of the object in a large range of reagent consumption changes (Figure 1.3).
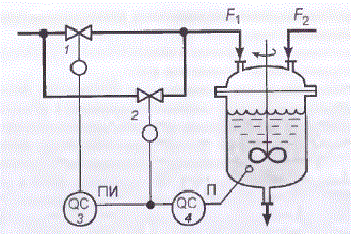
Figure 1.3 – Scheme of ph regulation using two control valves
The valve of small size (small conditional drift diameter) 2 with equal percentage flow characteristic conrtols P-controller 4, the output of which also is input to PI-controller 3, which has deadband. PI-controller controls a large-size valve 1 with a linear flow characteristic.
At small deviations from the pH value corresponding to the point of neutralization, when the gain of the object is large, the command signal P-controller is in the neutral zone of the PI-controller. The output signal of the PI-controller is not changed and the position of the large valve gate 1 remains the same. Regulation of the neutralization process is carried out by means of a small valve 2. Change of the command control signal leads to a small change in the reagent flow rate F1,so in this case gain of the actuator is small.
If the pH value strongly deviates from the value corresponding to the point of neutralization, so object operates in a mode where its gain is small, the command signal of P-controller exits the deadband of PI-controller. At this time small gate valve is in one of the extreme positions, and regulation is carried out with the help of a large valve. Change of command control signal results in a large change in the reagent flow rate F1,so in this case gain of the actuator is large. Thus, change of the gain of the object is compensated by the change of gain of the actuator. Naturally, complete compensation of gain change control loop can be effected only at a certain ratio between the pH value and the degree of opening of both valves (of large and small sizes) [3].
Thus, a method for automatically adjusting the pH value, providing high static and dynamic accuracy maintain the desired pH, as well as improving performance of the electrolysis process is an urgent task.
2 Analysis of the electrolysis process as a control object
The purpose of the regulatory process is to ensure the maintenance of the pH of aqueous solutions of NaCl (anolyte and brine) to the stages of its preparation and submission directly to the electrolysis. Changing of the pH value is carried out by changing the acid flow rate (alkali),which applied to the respective nodes of TP.
The best performance efficiency of the electrolysis process (such as cell voltage, current efficiency, and others.) In a diaphragm electrolysis and mercury are achieved by applying them to an acidified brine with a pH value not higher than 3.5 units.
When a diaphragm electrolysis cleared of impurities and saturated by NaCl brine is fed directly into the cell. In this brine purification from the impurities is carried out at a pH of the brine in the range of 9–11 units, and the recommended pH of the brine before feeding to the electrolyzers should be 2.5–3.0 units.
When the mercury electrolysis solution of NaCl (anolyte) leaving the cell, before returning it to the electrolysis stage passes dechlorination, additional saturation with NaCl and filtered. In this prior dechlorination of the anolyte brine and directly fed into the electrolytic cells must be acidified and basified to additional saturation of the anolyte. In particular, the anolyte with a pH of 3.5–4.0 before dechlorination must be acidified to a pH of 1.0–3.0, and then filtered to additional saturation and the pH of the anolyte should be 9–11 units. The pH of the brine before feeding to the electrolyzers should be 2.5–3.0 units.
As a rule, the anolyte and brine acidification nodes and node alkalizing anolyte are the same type of control objects. The circuit analysis of the electrolysis process as a control object from the point of view of material flow and material variables is shown in Figure 2.1.
Figure 2.1 – Scheme of process analysis as a control object
Fig.2.1 shows that the change in pH is carried out by changing the acid flow rate (alkali), which applied to the respective nodes of TP. Based on this, as a control variable we will take the pH value of brine, and regulating influence shall be realized as the change of acid flow rate F1.
In order to improve the quality of regulation it is necessary to provide a control system of ratio of acid flow rate F1, depending on brine flow rate F2.
The automatic control system of pH values of aqueous solutions provides a system of two loops. The outer loop – is controller of the concentration of hydrochloric acid, which corrects the reference signal output of flow rate of hydrochloric acid in relation to the brine flow rate. Inner loop – is regulator of flow ratio, which controls a flow valve of hydrochloric acid.
3 The purpose and objectives of the research
To provide high static and dynamic accuracy of maintaining the pH predetermined value is necessary to linearize non-linear dependence of the pH value of the concentration of acid or alkali (Fig. 3.1),so actually linearize non-linear sensor characteristic pH meter. The linearity of the system will be ensured, if the controlled variable does not use the pH and the converted value of this quantity, namely the inverse function of the pH dependence of the concentration of acid or alkali [4].
For acidic solutions the conversion is carried out by the expression:
| CHCl = 10-pH, | (3.1) |
alkaline by the expression:
| CNaOH = 10pH-14, | (3.2) |
The form of this dependence is shown in Figure 3.1, where the concentration of the acid also provisionally adopted as negative.
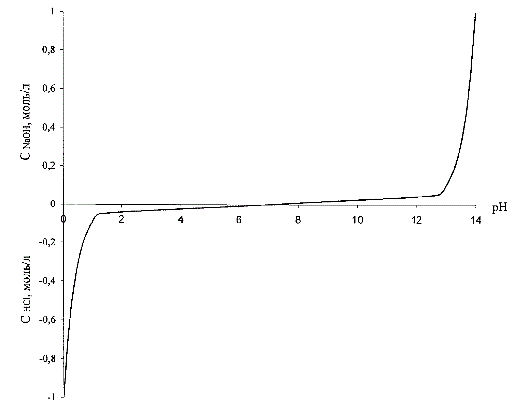
Figure 3.1 – Dependence of the concentration of acid (alkaline)to the pH solution
Setting to the regulator should be submitted in the same units as the controlled variable. Therefore, the reference signal before being applied to the controller must also be converted by the above expression (3.1–3.2).
Given the above, formulate the purpose – improving the efficiency of the electrolysis process due to the development of automatic control systems, wherein as the controlled variable is not the pH, but the inverse function of the pH dependence of acid concentration.
In order to achieve this purpose it is necessary to solve the following tasks:
1 To analyze the process of production of chlorine and caustic soda, and describe it as the object of control in terms of material flows and data variables;
2 Analyze the existing ACS to identify their shortcomings.
3 Build a block diagram of an automatic control system, the mathematical model of OC and ACS elements, synthesize the control law;
4 Prove the performance of ACS by mathematical modeling methods and analyze the dynamics of the synthesized ACS.
4 Modeling of ACS and analysis of the quality of regulation
In the developed automatic control system will be used principle of control by deviation with negative feedback.
This principle is one of the most common control principles. In accordance with this principle, the control system observes the object, which is influenced by disturbing factors. As a result, there are deviations in the behavior of the object. The control system monitors the observable parameters (variables), and creates a control algorithm based on observations [5].
The developed system has two loops. The outer loop – hydrochloric acid concentration regulator whose output adjusts the flow rate assignments in a ratio of hydrochloric acid to the brine flow. Inner loop – control flow ratio, a control valve of the flow rate of hydrochloric acid.
In accordance with the selected control ideology construct the block diagram of the automatic control system in the pH conditions of the production of chlorine and caustic soda.
The block diagram of developed ACS is shown in Figure 4.1.
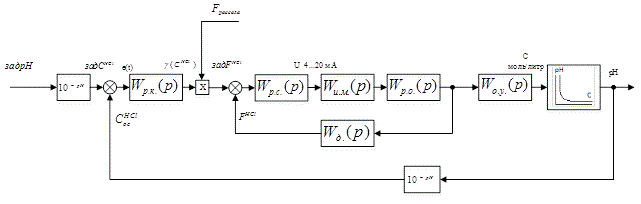
Figure 4.1 – The block diagram of developed ACS
In this block diagram:
W р.к.(p) &ndash.; TF of HCl concentration controller;
Wр.с.(p) – TF of ratio controller;
Wи.м.(p) – TF of actuator;
Wр.о.(p) – TF of control unit;
Wд.(p) – TF of flow rate meter of HCl;
Wо.у.(p) – TF of control object.
This is a cascade scheme with the principle of slave control. In the diagram, there are computational elements operating in the conversion of ph to the acid concentration.
Control object model is represented as a nonlinear dependence of pH on the concentration of hydrochloric acid.
This dependence is shown in Fig.4.2, where, in order to combine these two graphs on the same figure, the acid concentration is done conventionally negative.
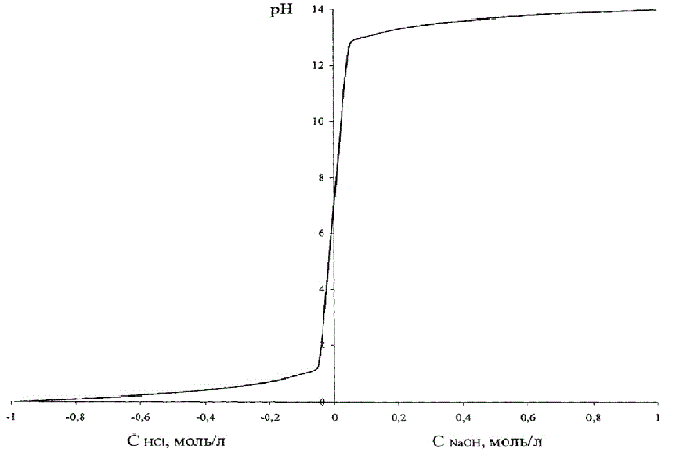
Figure 4.2 – Dependence of pH on the concentration of hydrochloric acid (alkaline)
The nonlinear dependence of the pH of the solution on the concentration of the acid can be implemented using applications LookUp Table unit package Matlab-Simulink, illustrated in Figure 4.4. The table lines contain values of acid concentration, and the cells of the table – the corresponding values of pH of the solution.
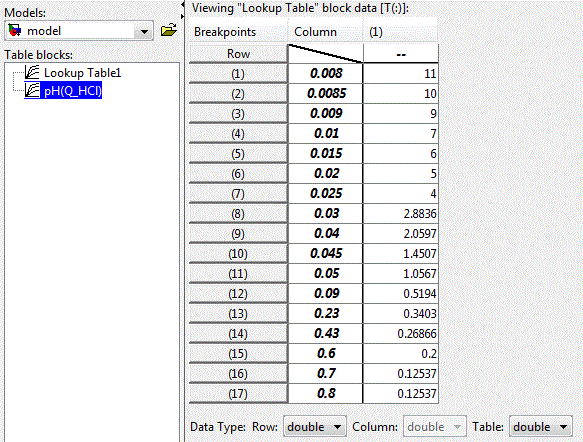
Figure 4.3 – Settings of LookUp Table
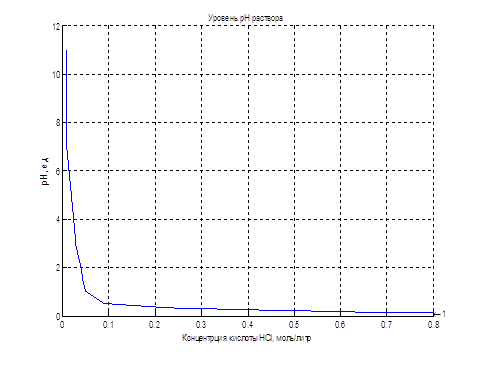
Figure 4.4 – Object realization using the LookUp Table
Since the idea of control is the linearity of system by selecting as the controlled variable not the pH, but the converted value of this quantity, namely the inverse function of the pH dependence on the concentration of acid or alkali. We realize it computationally by modeling the scheme, shown in Figure 4.5.
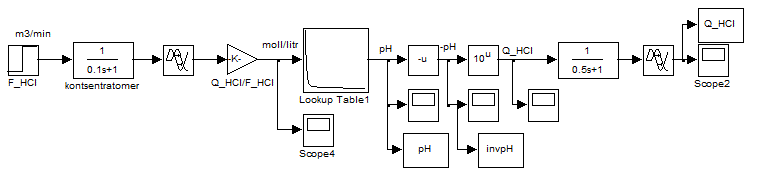
Figure 4.5 – Scheme of conversion values of pH in the reverse function according to the formula CHCl = 10-pH
In this scheme, we obtain the graphs (Figure 4.6) explaining the statement of a problem of control.
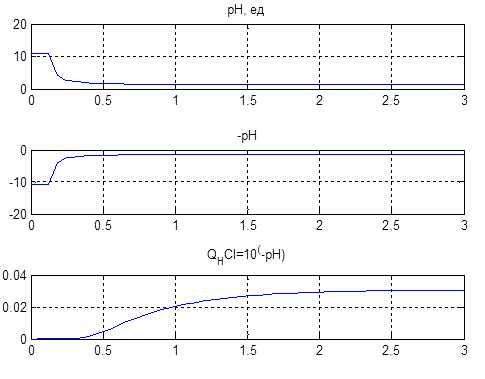
Figure 4.6 – Conversion values of pH in the reverse function according to the formula CHCl = 10-pH
The lower graph Figure 4.6 on the horizontal axis is the value of the solution level. So required level of pH is at 2…3 units. It corresponds to a linear change in acid concentration of 0.02…0.03 mol/liter.
Next, consider mathematical models of ACS elements. The mathematical model of the pump will be implemented in the form of a delay element of the first order with delay.
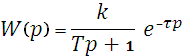 , , |
(4.1) |
where K – static transfer coefficient;
T – time constant;
τ – delay time.
In the developed system of automatic control of pH value, these values will be respectively K = 1; Т = 0.1 s.;τ = 0.1 s.
A mathematical model of pH-meters will also be implemented as a delay element of the first order with delay. The coefficients which are equal K = 1; Т = 0.5 s.;τ = 0.5 s.
We construct and analyze the dynamics of the HCl concentration of the regulator and the regulator flow rate ratio of hydrochloric acid and brine. Block diagram of the ACS will be built in accordance with the principle according to the deviation (Figure 4.7)
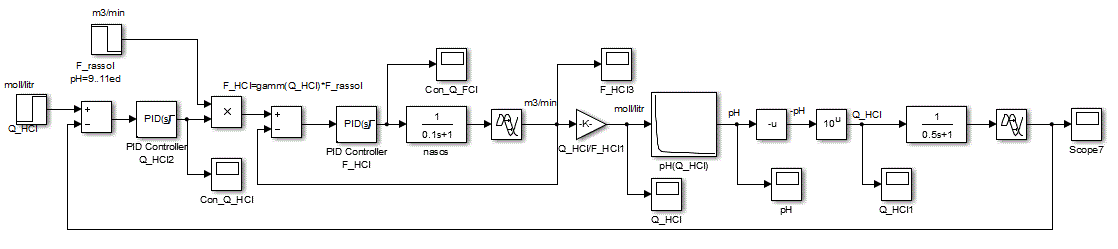
Figure 4.7 – Block diagram of the ACS
The main objective of the synthesis of ACS is to choose the regulating law and determine tuning parameters of the controller. It is assumed, based on the practical experience of automation related OC, to use in the inner loop PI control law, and the outer loop PID law, because the object has inertia properties with delay [6].
The setting parameters sufficiently close to the optimum, can be obtained from a study of the dynamics of the closed system. As a method of finding the tuning knob settings, select a method of automatic tuner PID-control Matlab simulation package as automatic optimization methods are a powerful tool of modern industrial controllers. automatic adjustment method is based on three phases: identification of the object model, the definition of controller parameters and configuration settings [7].
The choice of the above-mentioned method is due to the fact that the controller parameters defined by existing and widespread methods of Ziegler and Nichols, as well as CHR (Chien, Hrones and Reswick) then adjusted manually or automatically in the process of analyzing the dynamics of SAR.
PI controller internal circuit is defined by a PID-controller unit with standard libraries Matlab Simulink. After the default configuration of the PI controller in the PID-controller unit (Fig. 4.8), the coefficients of the proportional and integral components of the regulator will take the form shown in Fig. 4.9.
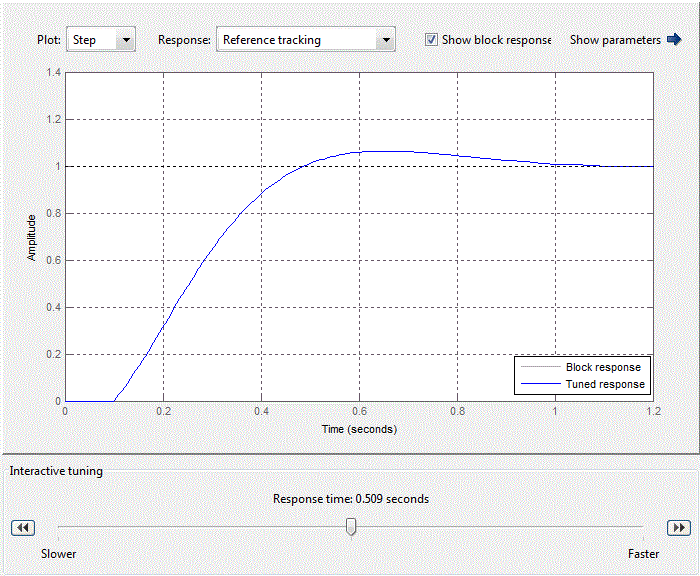
Figure 4.8 – Standard setting of PID-control block
Figure 4.9 – Coefficients of PID-controller block
When adjusting the regulator focuses on working out changes in the setpoint, as hydrochloric acid adjusting circuit in relation to the flow rate rate of the brine circuit is an internal value SAU pH. Thus tuning parameters PI have the following meanings:Kp = 0.25924, Ki = 4.0968 providing performance equal 0.509 s (Fig.4.9).
The PID controller of the external circuit is defined by a PID-controller unit with standard libraries Matlab Simulink. After setting the standard PID controller in the PID-controller unit (Fig. 4.10), the coefficients of the proportional, integral and derivative components will take the form shown in Fig. 4.11.
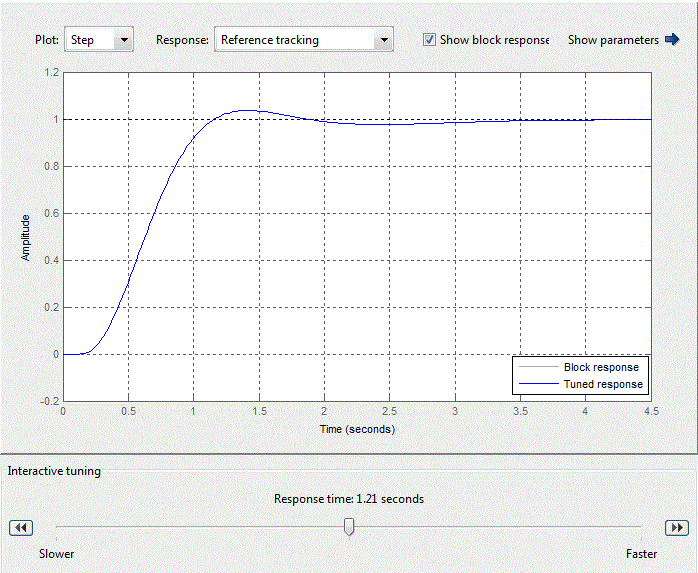
Figure 4.10 – Standard setting of PID-control block
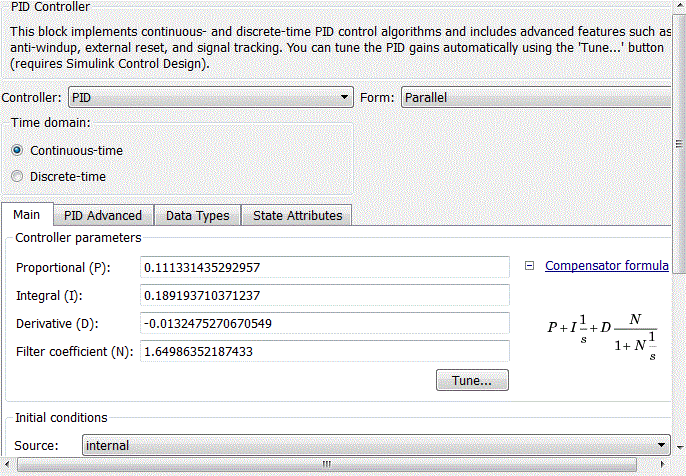
Рисунок 4.11 – Coefficients of PID-controller block
Simulating system with received regulatory settings.
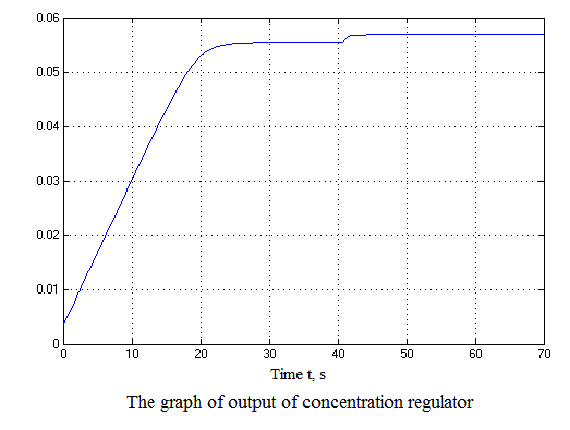
Figure 4.12 – Results of simulation(animation: 7 frames, 7 cycles, 50 kilobytes)
After analyzing the simulation results shows that the overshoot is no more than 1%, the adjustment time is 35 s that satisfies the requirements of the system.
Conclusion
Analyzed the process flow diagram of the production of chlorine and caustic soda. The analysis of the process as a control object.
Analysis of existing systems of automatic control the pH value in the conditions of the diaphragm and mercury electrolysis revealed shortcomings and formulate the purpose of the work.
The mathematical description of the ACS and the pH of the elements of ACS. The flow diagram. Synthesized regulators rascchitany factors for PI and PID controllers.
The results of the simulation confirmed the ACS system performance in line with the required parameters of quality of regulation.
In writing this abstract, master's work is not yet complete. Final completion: May 2016. The full text of work and materials on the topic can be obtained from the author or his scientific adviser after that date.
References
- Беспалов А. В., Харитонов Н. И. Системы управления химико-технологическими процессами. Учебное пособие для вузов. – М.:Академкнига, 2007 – 690 с.
- Беспалов А. В., Харитонов Н. И. Задачник по системам управления химико-технологическими процессами. Учебное пособие для вузов. – М.:Академкнига, 2007 – 690 с.
- Байназаров З. А., Бурдыгина С. В., Горин В. Н., Дмитриев Ю. К., Зайнетдинов Ф. Ф., Киселев А. П., Лернер А. С., Федоров А. М., Япрынцев В. Н.,Ярошевский В. В. Патент РФ № 2284048. Закрытое акционерное общество
Каустик
, 2006. - Дорф Р., Бишоп Р. Современные системы управления. – М.: Лаборатория Базовых Знаний. – 2002 – 832 с.
- Лукас В. А. Теория управления техническими системами. Учебный курс для вузов. Екатеринбург: Издательство УГГГА, 2002. – 675 с.
- Филлипс Ч., Харбор Р. Системы управления с обратной связью. – М.: Лаборатория Базовых Знаний, 2001 – 616 с.
- Денисенко В. ПИД – регуляторы: принципы построения и модификации. Статья, 8 с.
- Нестеров А. Л. Проектирование АСУТП. Методическое пособие. Книга 1.– СПб.: издательство ДЕАН, 2006. – 552 с.
- Нестеров А. Л. Проектирование АСУТП. Методическое пособие. Книга 2. – СПб.: Издательство ДЕАН, 2009. – 944 с.
- Simatic S7-300. Технические данные. Руководство. Издание 2004 – 308 с.