
Comparative assessment of value chains of global hydrocarbon market operators
Content
- Introduction
- 1. Relevance of the topic
- 2. Purpose of research
- 3. Analysis of recent research and publications
- 4. The main results of the research
- Conclusion
- References
Introduction
On the territory of the Russian Federation produces about 12.6% of the global volume of liquid hydrocarbons, and oil reserves amount to 6.4% of the world's proved reserves. However, the extensive model of extraction, processing and sale of hydrocarbons leads to the fact that the state's share in the world fuel and energy market decreased from 11.8% in 2015 to 9.0% in 2017 [14].
At the same time, the currently available uniformity of value chains requires additional research in terms of their application, taking into account the objectives of the assessment, the specifics of the economic entities and the choice of evaluation parameters for each link.
1. Relevance of the topic
The relevance of the study is determined by the fact that the main reasons for the loss of influence of the Russian Federation in the global hydrocarbon market are mainly associated with «failures» in the work of individual links in the value chain of the main operators of the hydrocarbon market. The main Russian operators of the global hydrocarbon market are Gazpromneft, LUKOIL and Rosneft, and their competitors are ExxonMobil, British Petroleum (IZ), Shell, Petrochina, Petrobras, Eni
2. Purpose of research
The purpose of the study is to conduct a comparative assessment of the value chains of the world's hydrocarbon market operators and to develop recommendations for improving the efficiency of their links.
3. Analysis of recent research and publications
The idea of the cost approach was proposed by Gluck [10] and R. Bueron [7], and subsequently widely popularized by the well-known classic Of management M. porter [5]. In the most traditional interpretation, the value chain is a set of consistently interrelated types of economic activity, each of which contributes to the formation of both the costs of business entities and their results depending on its functional purpose [2]. It begins with the creation of a specific product and ends with its delivery to consumers [4]. A similar interpretation is used and the experts of the Organization for economic cooperation and development the only difference is that in the sphere of their interests are the international chain of value added creation [13].
4. The main results of the research
With a focus on the industry aspect, the value chain of the world's hydrocarbon market operators can be presented in the following form (Pic. 1).
Figure 1 - Value Chain of global hydrocarbon market operators
(animation: 7 frames, infinite repeat cycles, 27.2 kilobytes)
So, the first two links in the value chain are exploration and production of liquid hydrocarbons. The main parameters that make it possible to make a comparative assessment of the effectiveness of primary units can be the volume of proven oil reserves, the availability of proven reserves in years, as well as the volume of production of these reserves. Thus, in 2017, the largest increase in reserves is observed in Rosneft (2.3% compared to 2016), Petroshina (1.5% compared to 2016) and Shell (1.4% compared to 2016) (Pic. 2).
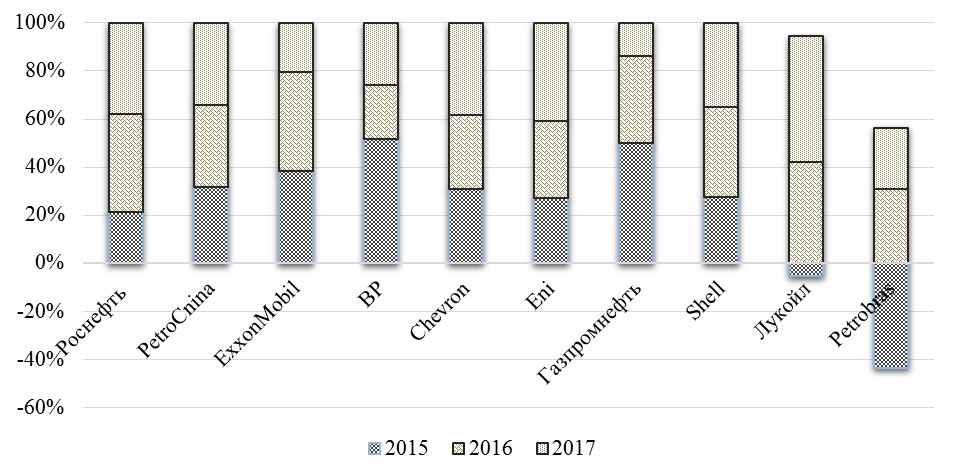
Figure 2 – Growth of reserves of the world operators of the hydrocarbon market, 2015-2017 yy., %
However, the reasons for the growth of reserves of the world operators of the hydrocarbon market are different. In Rosneft, the increase in this parameter was achieved through the opening of the 31st new field in 2017, and in foreign companies-to a greater extent through the use of new technologies aimed at increasing the recovery rate of liquid hydrocarbons, improving the processes of washing the reservoir and displacing more crude oil from the rock. The second parameter of the comparative evaluation of exploration and production links is the company's proven hydrocarbon reserves (Pic. 3).
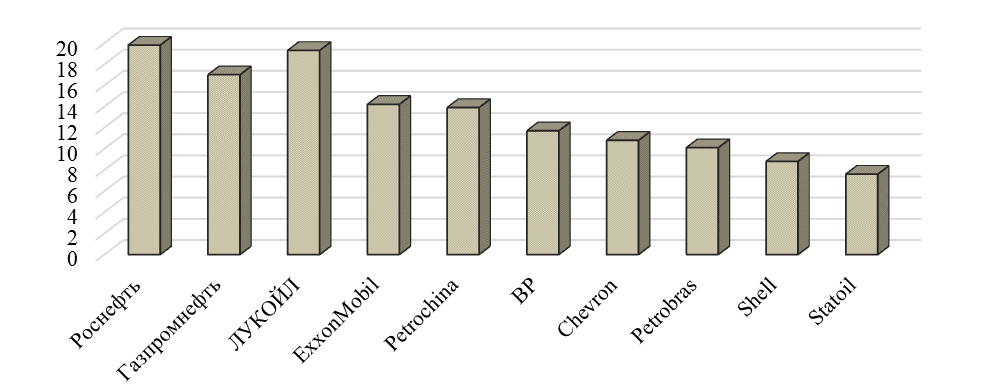
Figure 3 – Provision of proven reserves to world operators of the hydrocarbon market, 2017, years
A comparative assessment of the "proven reserves" parameter points to the advantage of Russian operators of the global hydrocarbon market: in Rosneft, this figure is 19.8 years, in LUKOIL – 19.3 years, in Gazpromneft – 17.0 years. This indicates a high intensity of work in the field of exploration and production. The leading positions of Rosneft are provided by the discovery of new fields and the implementation of large-scale projects for the development of hydrocarbon resources of the continental shelf. For example, in 2017. in commercial operation was introduced such deposits as kondinskoe, North Tyamkinskoye, Kashinskoe and North Tamarginskoye, commissioned Yurubcheno-Tokhomskoye field (Krasnoyarsk Krai) in the mode of comprehensive testing. During the development of these fields, new drilling technologies (including drilling wells with horizontal completion) are used, which have successfully proven themselves in the existing fields of the company [1].
LUKOIL completed the construction of 82 wells only in 2017, the efficiency of exploration drilling of which was 87%. It is possible to assess positively the conduct of similar works in the Caspian sea, which will allow to obtain a synergetic effect with previously discovered in the region large deposits owned by the operator [3].
Among the presented Russian operators of the global hydrocarbon market, Gazprom Neft (17 years) demonstrates the lowest indicators of proven reserves provision, which is due to the state of the resource base of current assets, which is characterized by the deterioration of the structure of the remaining industrial reserves due to the entry of most fields into the late stage of development [6].
Comparing the parameters of the operation of the sphere of production of liquid hydrocarbons of world operators, it should be noted that the Russian companies are quite high in terms of the volume of reserves received per day. For example, a company Gazpromneft is an indicator equal to 1523 thousand barrels./day., in Rosneft – 1078 thousand barrels./day. in LUKOIL – 1636 thousand barrels./day. The main competitors of Russian companies in the world market of hydrocarbons have the following values of the considered parameter: in PetroChina – 1720 thousand barrels./day., in ExxonMobil-959 thousand barrels./day., in BP – 1050 thousand barrels./day. and Chevron – 879 thousand. Barr./day.
In addition, Russian companies demonstrate lower production costs for liquid hydrocarbons compared to their foreign competitors. The average value of this indicator for the last three years in Rosneft was $ 2.8. U.S. / bbl. ad, in Gazpromneft – $ 3.9. U.S. / bbl. ad, in LUKOIL – $ 4.2. U.S. / bbl. ad, in ExxonMobil – $ 12.6. U.S. / bbl. ad, Petrochina – $ 12.1. U.S. / bbl. ad, BP – $ 8.7. U.S. / bbl. ad, in Chevron – $ 13.1. U.S. / bbl. ad, in Petrobras – $ 11.0 U.S. / bbl. ad, in Shell – $ 11.7. U.S. / bbl. B. E., in Statoil-5,6 dollars. U.S. / bbl. ad.
The advantage of Russian operators in the cost of production is formed by the low cost of labor involved in the production of liquid hydrocarbons, increasing in recent years, the resource return of layers, low operating costs. However, despite the obvious differences in the actual value of unit production costs among Russian and foreign operators of the global hydrocarbon market, these indicators are not so optimistic in the dynamics. For example, over the past three years, the average growth in unit production costs of Russian companies amounted to 11.0%, while foreign competitors showed an average decline of 16.4%. BP (-32.4% in 2017 compared to 2015), Statoil (-23.0% in 2017 compared to 2015) and Chevron (-21.9% in 2017 compared to 2015) showed the most noticeable dynamics in the direction of reduction of unit production costs, while Rosneft (by 23.1%) and Gazpromneft (by 5.1%) showed the most pronounced dynamics of increase.
Sufficiently representative of the efficiency of the link responsible for the processing of liquid hydrocarbons, reflects the Nelson index, which evaluates the level of secondary conversion power at the refinery in relation to the primary distillation power. Experts of the International energy Agency believe that refineries with a Nelson index of less than 10.0 are initially doomed to lose in the competition that is unfolding in the global hydrocarbon market. Among the world operators, the highest value of the Nelson index is noted in ExxonMobil (12.5%), Chevron (12.4) and Shell (11.5) (Pic. 4).
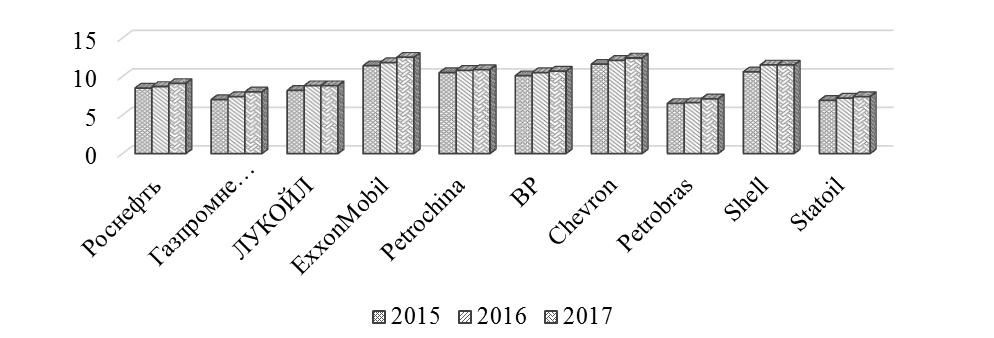
Figure 4 – Nelson index of world operators of the hydrocarbon market, 2015-2017, coefficient
The main reasons that constrain the positive dynamics of the Nelson index of Russian operators are associated with insufficient investment in the technological development of oil refining capacity (especially specializing in the processing of heavy oil).
According to the final value chain link, which carries out the functions of hydrocarbons sales, we can note the predominant orientation of Russian operators to Mature markets. For example, Rosneft's export policy is aimed at increasing its market share in China, Belarus, Central and Eastern Europe. Also, despite LUKOIL's predominant orientation to the external market (the share of products sold on the international market in 2017). 80.7%), yet excessive attention to the European region leads to the loss of opportunities to occupy niches in the fast-growing markets of developing countries. A similar situation remains with respect to Gazpromneft, whose main export flows are directed to the CIS countries and Europe.
Conclusion
On the basis of the comparative assessment of the value chain of the world operators of the hydrocarbon market, it is established that the development of Russian companies is possible only through a systematic increase in the efficiency of all links of economic activity.
In the field of exploration and production, it is advisable for Russian players in the global hydrocarbon market to focus on the introduction of high-viscosity oil production technologies, increasing oil recovery by drilling second wells in existing wells, improving the accuracy of forecasting the geological structure and structure of reserves in the areas of drilling second shafts, the use of environmentally friendly technologies for seismic exploration and drilling, etc.
The main directions of increasing the competitiveness of the links responsible for the processing of resources are seen in the involvement of petrochemical companies in the value chain, increasing the depth of oil refining by hydrocracking, reconstruction of oil refineries, reducing the energy intensity of production, the introduction of technologies aimed at the production of cleaner fuel, etc. Improvement of sales policy can be implemented in the direction of large-scale diversification of sales channels, expansion of product range, redistribution of export flows by increasing the share of companies in developing markets, taking into account the parameters of complementarity of countries, etc.
Particular attention should be paid to the digital transformation of all parts of the value chain and the introduction of digital technologies: digitization of oil production and the use of "smart wells", which allow to reduce the cost of field operation by an average of 20-25%, a quarter to reduce operating costs and 2-7 times to increase the oil recovery rate; automation programs of oil refining by replacing pneumatic systems with analog ones, which will improve the accuracy of achieving the expected result up to 90%.%; implementation of digital platforms for interaction with foreign partners, which will ensure higher loyalty of hydrocarbon consumers in the world market.
References
- Rosneft today [Electronic resource]. – Mode of access: https://www.rosneft.ru/about/Glance/
- Dementiev V. E. Russia's Place in global value chains / V. E. Dement'ev, E. S. Novikova, E. V., Ustyuzhanina // National interests: priorities and security. - 2016. - № 1. - P. 17-30.
- The company of JSC "LUKOIL" [Electronic resource]. – Mode of access: http://www.lukoil.ru/Company/BusinessOperation
- Idrisova V. V. Trade in value added: an empirical analysis / V. V. Idrisova, Yu. a. Litvinov O. // Bulletin of foreign trade. - 2016. - № 8. - P. 49-66.
- Porter, M. Competitive advantage. How to achieve a high result and ensure its stability / M. porter. - M.: Alpina Business Books, 2005. 452 p.
- Press center of Gazprom Neft [Electronic resource]. – Mode of access: http://www.gazprom-neft.ru/company/at-a-glance/
- Buaron R. New-Game Strategies / R. Buaron// The McKinsey Quarterly. – 1981. – № 1. – P. 24-40.
- Forbes составил рейтинг крупнейших нефте- и газодобывающих компаний мира [Electronic resource]. – Mode of access: http://www.forbes.ru/sobytiya-slideshow/rynki/84318-25-krupneishih-neftegazovyh-kompanii-mira-i-vladimir-putin-novyi-reit
- Four large-scale shifts in the global energy system set the scene [Electronic resource]. – Mode of access: http://www.iea.org/.
- Gluck F.W. Strategic Choice and Resource Allocation / F.W. Gluck // The McKinsey Quarterly. – 1980. – № 1. – P. 22–43.
- Performance data BP [Electronic resource]. – Mode of access: https://www.bp.com/en/global/corporate/sustainability/performance-data.html
- Statistical Review of World Energy [Electronic resource]. – Mode of access: https://www.bp.com/en/global/corporate/energy-economics/statistical-review-of-world-energy.html
- Trade in Value Added [Electronic resource]. – Mode of access: http://www.oecd.org/sti/ind/measuring-trade-in-value-added.htm
- Trade statistics for international business development [Electronic resource]. – Mode of access: https://www.trademap.org/Product_SelProduct_TS.aspx