
Report on the topic of final work
Table of contents
- Introduction
- 1. Bases of exchange trade
- 2. Essence of technical analysis
- 3. Facilities of technical analysis
- 4. Analysis of the systems of Means of technical analysis
- Conclusion
- List of the used sources
Introduction
The analysis of behavior of price of equities is characterized ambiguous behavior of process that has a trend and seasonal influences usually. Prognostication &of ndash; it is a key moment at the acceptance of investment decisions. Possibility to predict behavior of price of equities for the acceptance of eventual decisions allows to do the best choice that otherwise could be unsuccessful.
Except traditional statistical methods in the systems of support of making decision for a financial analysis different mathematical approaches and directions are used. In hired the autoregressive analysis of economic data is examined. There is a problem of calculation of coefficients of autoregressive equalizations at the design of processes. For the decision of this task there are next methods:
– least-squares method;
– recursive least-squares method;
– maximum likelihood method;
– recursive maximum likelihood method;
– method of moments.
For the decision of task of prognostication of price of equities the model of the two-tier system of support of making decision is developed. In hired the systems are worked out and realized for the calculation of coefficients of авторегрессии of equalizations of algorithms, such as a least-squares method and recursive least-squares method, for determination of order of авторегрессии of equalizations by an autocorrelation function and private autocorrelation function, for manipulation data possibility is given moving away of trend. For the increase of evidentness of job, system of support of making decision performances, on every stage of treatment of temporal rows the charts of data will be built, it gives possibility an user by sight to determine the features of models (presence of trend and seasonality). Also this system takes long-term prognoses into account, built by means of fundamental analysis.
Similarly in hired some questions of financial mathematics, touching the markets of equities, will be considered, namely actions &of ndash; one of basic types of securities. In an appeal, by firms and financial mediators with the purpose of accumulation of facilities, or capital produce securities of two basic kinds : actions and bonds. There is fundamental dependence between the cost of securities and profit from them. There are many methods that help to make decision on the tosale of securities.
There is an exchange stock &ofndash; in the general understanding; it is the organized market, where the bearers of securities carry out through the members of exchange stock, that come forward as mediators, transaction of purchase-sale.
There are exchange stocks &ofndash; in the narrow understanding; it is the special establishments that create terms for the constantly operating centralized trading in securities by the association of demand, suggestions on them, grant of place, system and facilities, both for the primary placing and for the secondary appeal of securities.
Table of contents of concept exchange stock
historically tested permanent changes. At first exchange stocks were name the special places, where salespeople and customers of securities gathered and the transactions of purchase came true.
Exchange &ofndash; it a noncommercial market structure or organized, regularly operating market of commodities and services share within the framework of that comes true row of operations (redistribution of capital, commodities and other fund values).
1 Basis of exchange trade
In the terms of more increasing globalization of modern world economy a considerable role is played by fund markets. Processes that take place on them influence on development not only of separate countries, and all worldwide policy. The correct understanding and research of processes, take place on fund markets, has large influence and for the Ukrainian economy, especially on the threshold of entering into Worldwide trade organization. Therefore this division of work is devoted exactly description, analysis and principles of construction of exchange stock. Tasks, structure, facilities and essence of technical analysis of exchange stock, are examined in detail.
Exchange stock &ofndash; it is the organized market, where the bearers of securities carry out through the members of exchange stock, that come forward as mediators, transactions of purchase-sale. Prices on these securities are determined by suggestion and demand on them, and the process of purchase-sale is regulated by rules and norms [1].
Итак, exchange stocks &ofndash; it is the special establishments that create terms for the constantly operating centralized trading in securities by the association of demand, suggestions on them, grant of place, system and facilities, both for the primary placing and for the secondary appeal of securities. They must work on single rules and on single technology of electronic appeal of securities, by the certain National exchange stock. Any mediator can become the member of exchange stock at the market of equities, sticks to and executes the requirements set by status and to the rules to this exchange.
The securities admitted to quotation on an exchange stock must be served by the system of the National depositary. The state will control as far as honest and just are rules of exchange stocks and procedures of listing for the participants of fund market, accordance of facilities to organization and supports of trade of aim of the effective opening of prices on securities, will assist the unitization of exchange rules. The state through exchange stocks can carry out placing of state securities [2].
On the stage of privatizing of property of state enterprises through exchange stocks there can be the primary placing of that stake of actions of the largest enterprises, realized for monetary resources, for determination through quotations of market value of actions.
History of exchanges counts almost five centuries, some specialists assert although, that the first exchange in Japan existed in the first century to our era.
The first exchange of international level was created in Antwerp of 1531. She is a small own apartment, above an entrance it was written in that : For the trade people of all people and languages
. The Throgmorton fund street arose up in XVII of item, New York – in 1792. In 1763 the first exchange is in Ukraine (Odesa).
Table of contents of concept exchange stock
historically tested permanent changes. At first exchange stocks were name the special places, where salespeople and customers of securities gathered and the transactions of purchase came true. For both parties it was comfortably to meet locally, knowing that there they will be able to find partners on a transaction.
In future exchange stocks began to grow into the establishments specialized on the grant of services in organization and material providing of trade securities. It influenced on the methods of piling and feasance of transactions of purchase-sale, that began to consist in certain dates and time. The circle of participants of exchange trade and list of securities began to be more clearly determined, on the purchase-sale of that it was settled to conclude transactions on an exchange.
Gradually mediators became the main participants of these торгов. To the issuers that wanted, that their securities were quoted on an exchange, more high requirements belonged in relation to the sizes of charter fund, general amount of securities, to financial and economic ability and others like that. Итак, exchange stocks from establishments, providing, mainly, material and technical maintenance of trading in securities, gradually grew into establishments that allow to carry out торги to the certain mediators and specialists with certain securities and in set time on the basis of the rules of conclusion and execution of transactions set by an exchange.
Итак, the function of organization of process of the exchange trading in securities becomes one of functions of exchange stocks. Exchange stocks began to grow into institutes, regulative the order of admittance of securities to quotation on an exchange, in participating in торгах, conclusion and implementation of agreements. Computerization of exchange trade did exchange stocks yet more perfect instrument of adjusting of market of equities. Evolutional development of exchange stock is gradual with Places
trade in establishments
entered into the next, modern phase &ofndash; transformations of these exchanges with establishments
in difficult, organizationally executed and well equipped by computer facilities systems
trading in securities. It took place so: the methods of realization of trading in securities change on exchange stocks (traditional auctions from voice
began to be complemented by electronic торгами).
In a number of cases trade (brokers) participants got possibility to conclude transactions with securities, quoted on exchanges, being outside an exchange stock. Some exchange stocks began to carry out not alone, and a few quotations of securities (different modes of admittance of securities to the appeal &of ndash; estimation of quality, reliability and perspective of securities). The value of informative factors (equal possibilities of access of participants of exchange trade are in information) grew sharply. Moral factors began to play a large role (decency, goodwill, honesty, sociability etc.).
Thus, the study of development of exchange stocks allows to pass directly to the study of terms of creation and functioning of exchange stock.
An exchange stock is, in fact, by the organizational market of equities, functions on the basis of the officially registered rules conducts of trade, on that agreements on placing those the purchase-sale of securities or their derivatives come true by a limit amount of exchange mediators.
Legal entities, certain a legislation as the centralized markets and electronic trade-informative networks on that constantly trading in securities or their derivatives comes true are organizationally executed, can get status of exchange stock, if they conform to the next requirements [3]:
–conclusion of exchange transactions only between founders and members of exchange and electronic trade-informative networks;
–presence of procedure of selection of securities or other financial instruments that answer certain requirements on the terms of their producing and appeal;
– presence of procedure of selection of securities or other financial instruments that answer certain requirements on the terms of their producing and appeal;
– high level of concentration of demand and supply on securities;
– determination of market prices on securities as base determination of market prices on securities as a base index for the indication of fund market and market of derivative securities condition;
– grant other, except trade, services to the clients only through mediation of members of exchange;
– presence of rules of selection of brokers-dealers and requirements on their professional qualification;
– presence of rules (regulation) of trade and standard trade procedures;
– establishment of official exchange course, centralization of registration of transactions and calculations on them;
– presence of the checking above activity of members of exchange and brokers-dealers and observance system by them norms of professional and business ethics;
– presence for leaders and leading specialists of exchange stock, brought over to exchange activity, qualification of specialist of corresponding profile, according to the list of types of professional activity at the market of equities, that is confirmed by the qualifying certificate (by a certificate) of standard pattern, given out by an attestation commission, composition and order of work of that are too determined by a corresponding commission to the exchange stock;
– providing of the stable and effective functioning of the system of information about securities and other financial instruments, their prices and terms of appeal.
Pursuant to the first rule of exchange stock must provide for :
– types of the transactions concluded on an exchange stock;
– trade order on an exchange stock;
– terms of admittance of securities on an exchange stock
– terms and order of subscription on the securities quoted on an exchange stock;
– order of forming of costs of state course and their publications;
– list of the securities quoted on an exchange stock
– duties of members of exchange stock on registering and information, internal order of work of commission of exchange stock, order of their activity;
– system of dataware of exchange stock;
– types of services of exchange stock and sizes of paying for them;
– other positions.
An exchange stock executes the row of functions [4]:
– she opens to the legal entities access to the loan capital by producing and sale of securities, here a capital becomes property of issuer;
– an exchange stock promotes and provides transfusions of capital of issuer from one sphere of activity in other, from one legal entity to other;
– an exchange stock serves as an important channel for placing of state securities, through her it is mediated a management comes true by a national internal debt;
– an exchange stock is one of economic stabilizators, that is mounted in the system of commodity-money relations and promotes at this protracted and to dynamic development of economic mechanism;
– an exchange stock provides effective secondary market development.
2 Essence of technical analysis
There are two different approaches for research and prognostication of share price : technical and fundamental analysis. In hired both methods are used. In this division we will consider a technical analysis in more detail.
Technical analysis &ofndash; this research of dynamics of basic indexes of market by means of graphic methods with the purpose of prognostication of future directions of their motion [5].
A technical analysis uses the far of participants of exchange and ex-pit markets. Successful floor trader of А. Элдер figuratively spoke out on this occasion : A technical analysis is family to questioning of public opinion. This combination of science and art. scientific part consists in the use of statistical methods and computers; creative part &ofndash; interpretation of the obtained data
. A technical analysis is base on three statistical estimations of exchange trade, namely:
– prices;
– trade volumes;
– amount of open positions or open interest.
А. Элдер underlines that in foreign practice there are two looks to the technical analysis. From the point of view of psychologist, a technical analysis is determined as a graphic image of socially-psychological processes of market. From the point of view of mathematician, a technical analysis is the graphic reflection of ordinary statistical processes. Becoming of technical analysis takes place in the end the XIX century. The creator of this direction Charles Dow isconsidered – editor-in-chief of newspaper The Wall Street Journal
, that first used the statistical methods of analysis of temporal rows at the share market. A modern technical analysis uses когнитивную psychology, by means of that an analyst knows itself and market better, allows newly to estimate different market processes, growingly [6].
On foreign markets financial information generators are directly oriented on behavior of investors. No doubt, most accessible and the most used information generators are financial divisions of newspapers. Newspapers with the skilled state of financial release give not only information about basic business and financial news but also, as a rule, the comments. In the USA and Europe, except main financial newspapersThe Wall Street Journal
, Journal of commerce
,Financial Times
,Investor Daily
etc., there are more than thousands of investment information generators [7].
The most powerful in the world services of financial information are the systems of tickers (exchange telegraph) belonging to the corporation Dow Jones and Company
and work around the clock real-time, and news agencies Reuters
, AFX
, Knight Ridder
, Futures World News
.
Reflecting many-sided nature of modern society, the investment environment of foreign financial markets gives unlimited possibilities for investing. Today investors can form the brief-cases not only from the actions and bonds, quoted on the well-known exchanges of the world. They buy securities of the small companies placed on all earth, including and in постсоциалистических countries. The profitable bonds provided with the pool of mortgages, bills of exchange with a variable rate, swapfiles, options and contracts of the futures, become more widespread on foreign markets.
.Investor personally or through the institute of the joint investing, exchange broker constantly works with exchange quotation tables, trying by means of price and courses analysis to envisage their behavior.
A fundamental analysis is complicated from a market tendency not to take into account and, accordingly, not react on well-known factors and co-ordinate prognostications of market with them. This tendency destroys logical connection between a market and economic state. For example, governmental purchases or sales of strategic supplies of raw material on weak markets can result in a price advance and others like that. Market participants differently react on news. Requires some to convincing information, what other, analysis of specific factors for a decision-making about a purchase or sale. Psychological factors inherent to the certain merchant, slow distribution of information and return reaction, can provoke such behavior on market changes.
The supporters of technical analysis (techniques) study an exchange market both single unit or market both external and internal factors influence on that. Techniques are convinced, that, as markets consist of people, that, as a rule, is not inclined quickly to change the looks, their operating on a market under identical circumstances will recur.
In spite of high cost of technical analysis, he is very popular among traders. Most analysts, as a rule, use limit data &ofndash; prices and volumes. They can be quickly collected, analyse and keep. That it can to the markets of 50th of XX of century, Can recur and today, and, successfully used for making of trade strategies [8].
A technical analysis is base on supposition, that prices change on steady temporal models. Those, who adheres to this theory, name chartists ( from the word of chart – diagram), as they analyse the diagrams of price-waves and courses and find out repetitive models. Fundamental analysts investigate conformities to law, that will operate in the future, and the look of technical analysts is directed in the past. Substantive provision of technical analysis [2]: all at the market, since catastrophes ending psychology of traders, results in a height or slump of prices.
A technical analysis supposes the study of internal information of exchanges. Word technical
means the study of market, but not external factors, reflected in the dynamics of market. Technical analysts try to forecast short-term price and courses changes and on the basis of this prognosis give to recommendation at times of settlement of a transaction, certain contract or market on the whole. Conception of technical analysis is base on existence of historical conformities to law. Techniques assert that the study of past price and courses changes on futures-trading and fund exchanges allows to the merchant to accept a correct decision today. Practically all technical analysts use eloquent, but enigmatic terminology. For example, the considerable height of course at the relatively large volumes of trade they characterize as an accumulation, and decline of courses at the large volumes of trade &of ndash; as distribution.
If at the fund market equities not changed direction during a considerable period, then it is considered that actions are inphase consolidation. A course outside that prices do not rise is named the level of resistance, course outside that prices do not go down, – by the level of support [9].
By information generators, except adopted higher, certificate and statistical editions of futures-trading and option quotations of world exchanges serve. Futures-trading quotations reflect all necessary for a technical analysis information:
– price in the moment of opening of exchange;
– higher and most subzero costs of day (interval of prices);
– cost of closing;
– validity of the contract;
– contract size;
– exchange торги took place on that;
– higher and most subzero prices for period of existence of contract;
– amount of open and not removed contracts;
– volumes of sales and purchase of options.
Basic task of technical analyst &ofndash; to educe conformities to law of the real motion of prices, catch the moment of break of tendency &ofndash; so-called signals of purchase and sale. Any receptions and methods of technical analysis can be used only for liquid markets with plenty of participants, where operations are executed regularly, in considerable volumes.
By the most popular instrument of technical analysts price charts. A construction of charts of price and courses change is one of the most ancient and most successful methods. Many the charts used by specialists for the exposure of market and points of fracture of trends tendencies.
Trend &ofndash; it is a tendency or unidirectional motion of the price kept flow of certain continuous period of time. Although Э. Найман marks that it is possible and needed to combine the relative chance of events at the market and his periodic трендовость [9]. It is reasonably enough possible to assert that:
– sooner or later some tendency appears at the market;
– a sooner or later dominating (dominant) tendency closes;
– nobody knows exactly, when and at what level a tendency will begin or will make off.
These conclusions allow to define the certain rules of technical analysis. So, a trader must estimate direction of dominating (dominant) tendency, her force and to define the life cycle of trend.
A technical analysis is base on next, the following postulates.
- A course or price takes into account all factors: economic, political, psychological. Cost &ofndash; market quintessence. In opinion of technicians, it is enough to analyse the charts of change of price or course, to do an exact prognosis. With these statements, especially for the short intervals of time (hours, day), both practices and theorists of markets consent;
- A price or course move only in the direction of trend. Trends are three types:
– trendbull
– prices and courses rise;
– trendbear
– prices and courses go down;
–lateral
trend &ofndash; prices and courses do not change. Longlateral
a trend, as a rule, supposes a priceI bore
– sharp height or slump of prices. - Events recur, id est laws of economy, psychology, physicists unchanging during considerable time. Exactly this postulate allows with greater probability to forecast the future on the basis of analysis of price tendencies in the past.
The schematic image of all types of trends can be seen on a picture 2.1.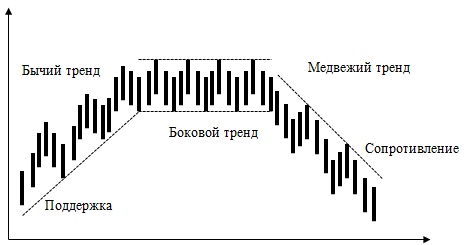
Picture of 2.1 – Schematic denotation of all types of trends
The aim of technical analysis it is been:
– estimation of current dynamics of prices;
– determination of certain trend;
– prognosis of term of action of trend, length of period of action of this direction (long-term, short-term);
– determination of phase of trend &ofndash; life cycle (origin, to maturity and completion);
– determination of amplitude of price of trend variation.
In other words, the aim of technical analysis is a directionfinding of motion of price, and also the best prices and time for the conclusion of transactions.
As we see, these suppositions really have many defects, however can and widely used in a technical analysis.
3 Means of technical analysis
Among facilities of technical analysis it is possible to distinguish four categories [2]:
– standards of charts of prices;
– method of observance of trend;
– analysis of market character;
– structural theories.
The first method of technical analysis is base on construction of different charts of price and courses change, volumes of торгов and exposure of so-called
figures
, that it is possible to notice in these charts. Techniques use corresponding software that today is so widespread, that joins in standard computer programs. Most applied in practice of technical analysis is to the column of diagram, linear charts, chartscrosses and zeros
, charts of segments (bars),Japanese candles
[7].Linear charts usually show time on the axis of OX and price on the axis of OY. A price is given by a vertical that can represent a certain period (day, week, month or some other term).
A line is traced shows prices from more subzero to higher or vice versa. Specific marks can be complemented by the pointers of prices or courses of opening and closing of market. Every subsequent period is presented on the right of previous. Specifies some other data on graphic arts, for example, trade volumes or a short comment adds to the unusual events that could influence on a market condition.
Some analysts prefer to build the charts of proportions, well-known under the technical name
semilogarithmic scale
. However them it is difficult to build without certain skills and knowledge of statistical methods of analysis. Large advantage of these charts is in that they specify on the rates of change, but not on a quantitative difference. On a percent chart, if funds grow on 0% in a year, a chart will have a form of straight line. If two funds will be compared, then more swift it will be raise that at that greater percent of change [9].In column diagrams like on the axis of OX put aside time, on the axis of OY – price.
Price and volumes of trade of contract of the futures changes on oil on the New York commodity exchange for a week.
Linear charts and columns of diagram are absolutely clear and evidently demonstrate price and trade volumes changes. Price changes on oil for an a week's interval are shown in a table 3.1.
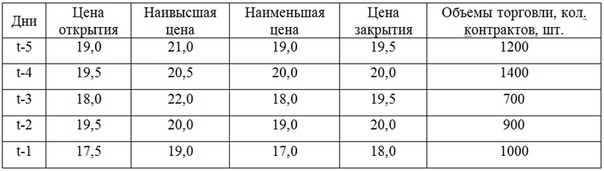
Table of 3.1 – Price changes on oil for an a week's interval
The schematic image of column charts is shown on a picture 3.1.
Picture of 3.1 – Schematic image of column charts
For an example we will consider price changes on oil for an a week's interval that is illustrated in a table 3.1 and, we will build columns picture 3.2. Prices are indicated in a dollar / for a barrel.
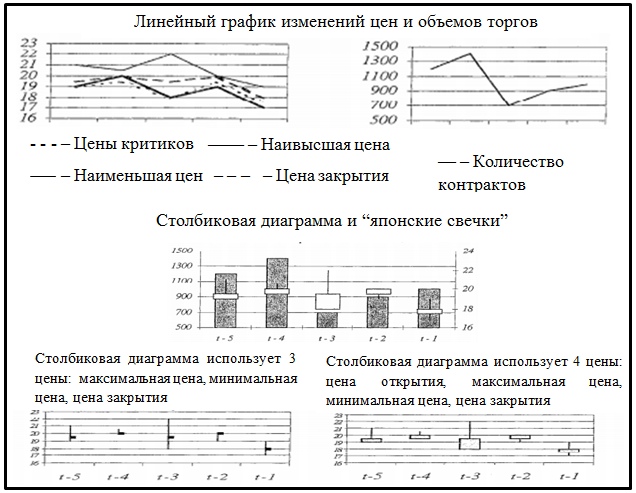
Picture of 3.2 – Examples of graphic reflection of a week's price and volumes of торгов changes on the petroleum contract of the futures
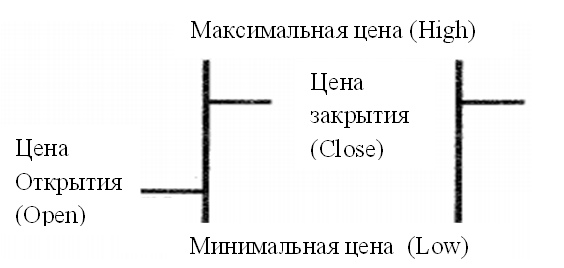
Additional explanation is required by the method of reflection of dynamics of prices by means of so-called
Japanese candles
. It is a very interesting method that lets to the merchant at once to see a picture daily behaviors of price. The examples of candles and their value are presented on a picture 3.3.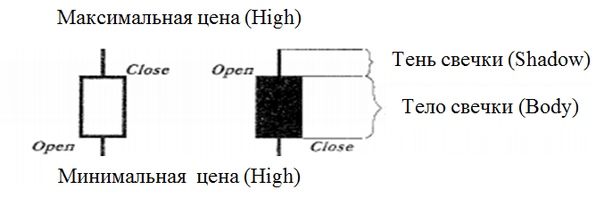
Picture of 3.3 – Examples of candles and their value
The basic difference of the Japanese candles from column diagrams is a presence of rectangle that is built in an interval between the costs of opening and closing of торгов. This rectangle is named
body of candle
(real body) [5]. Depending on correlation of costs of opening and closing of торгов, this rectangle can be painted out in a white or black color. A white color a candle has then, when cost of opening below of cost of closing, id est testifies that during the day of price rose. If body of candle of black, then it means that flow of day of price fell, and the cost of closing was below than cost of opening of tenders. Motion of prices forms higher than body of candleoverhead shade
(upper shadow), motion of prices below than body of candle &ofndash;lower shade
(lower shadow).The analysis of the Japanese candles comes true on three directions:
– force of body;
– force of shade;
– force of denial.
Force of body estimates length of body. What it is longer, the stronger there is a display of desire of market to go to certain direction : for a white candle upwards, and for black – downward. Force of shade shows, as far as a desire does not coincide market to go to certain direction with his possibilities. Force of denial consists in a simple rule: if a market did not go with force a body or by force of shade, then the more confidently he will go in retrograde.
Charts
crosses and zeros
were created only for the reflection of change of price. Time necessary for replacement of one price other, absolutely not taken into account. Unlike some linear charts, graphic artscrosses and zeros
does not take into account a volume. For example, it was concordantly at the fund market, that changes that will be taken into account can minimum make $ 1/8 and maximally – $ 2 or $ 3 for every action.The price parameters have contracts of the futures on raw material and currency. However every cell of chart can present this chosen sum. Each time at a price advance on a certain sum in a certain square to belong
x
, to specify changing. If prices will be raise, additionalX
to belong above each other. If a price will go down for the chosen level,x
will become in a next line on a cell below. A market will return at that rate, and chartcrosses and zeros
gets another name &ofndash;circulating chart
. For evidentness of column height beginx
, and columns of slump &ofndash;o
.If analytic geometry interests short-term changes, for example $ 1/8, then an active day on an exchange can fill many columns. And, vice versa, if he is interested by the protracted interval of time, then it is necessary to choose a step $ 3, that will allow to trace the tendency of motion of prices on small to the chart. Techniques, prefer to this method, are sure that the possible changes of direction of motion of prices, but also time of changes, can predict only. They do it by means of technique that is named a count (the count). On the whole the idea of construction of chart is such: the cost of closing of торгов is fixed so that in columns to form the trend (tendency) of price change, in other column of analytic geometry go across at appearance of other tendency, that is illustrated on a picture 3.4.
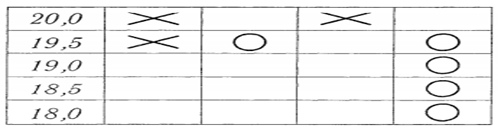
Picture of 3.4 – Example of chart
crosses-zeros
for a petroleum contractCharts form different
figures
, for that the analysts of technical analysis thought of the eloquent names. For this purpose charts are built for long period of time, for example month, year, ten and more than years. The example of such chart is presented on a picture 3.5.Most analysts use figures for description of lines of resistance, support, turn and origin of trends. Well-known analyst Е.Л. Найман asserts that the participants of futures-trading markets, analysing трендовые 33 models, must use the rule &ofndash; do not work against a trend. The most widespread denotations of descriptions of trend are indicated on a picture 3.6.
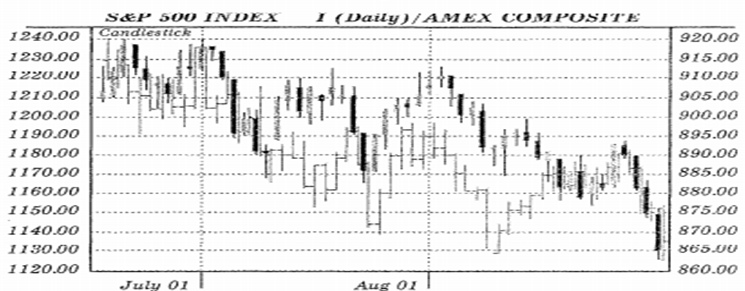
Picture of 3.5 – Example of image of chart of prices in form column diagrams and
Japanese candles
for a petroleum contract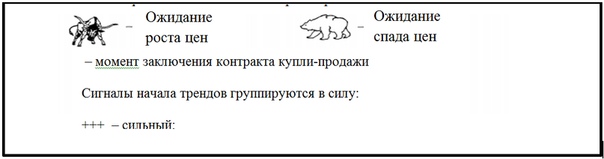
Picture of 3.6 – Most widespread denotations of descriptions of trend
We will illustrate some typical situations on a picture 3.7.
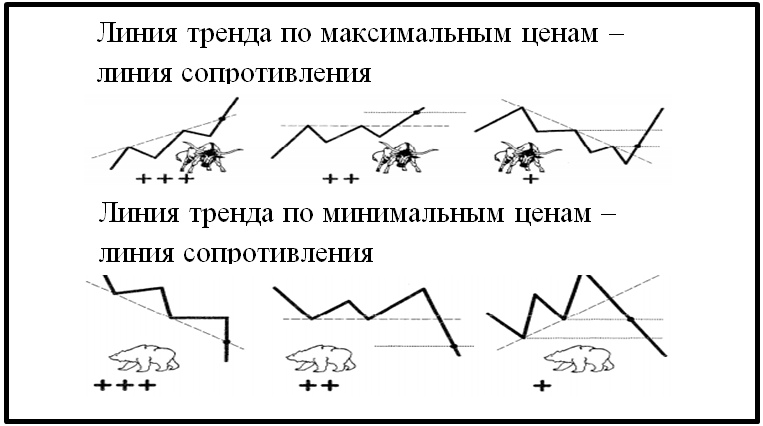
Picture of 3.7 – Typical situations of trendlines
Level of resistance &ofndash; it is local the highest price. At connection of local maximums the line of resistance is determined.
Level of support &ofndash; it is local minimum price. For the receipt of this line it is necessary to connect inter se standard of minimum prices. The typical organizational structure of exchange is given on a picture 3.8.
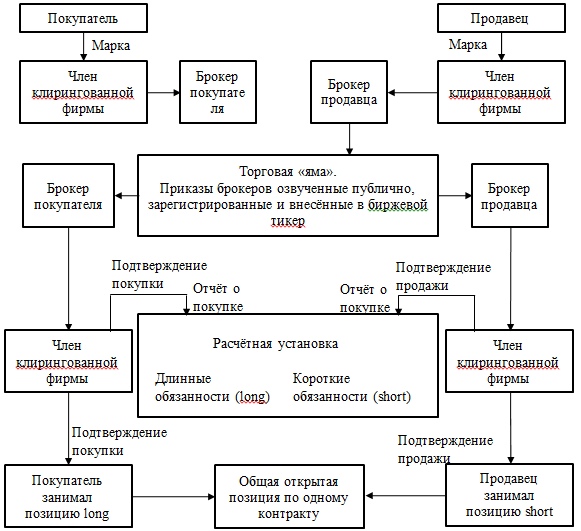
Picture of 3.8 – Organizational structure of exchange
This structure allows to understand, what organizational blocks an exchange stock consists of.
4 analysis of Systems
Model
black box
for the research and information system. For the construction of this model it is necessary to define the borders of control system, environment, entrances and exits of the system.Border of the system &ofndash; exchange stock.
As an environment comes forward : legislation, price of equities of the banking system, public data, MASS-MEDIA.
Included in the system
research and information system
are:X1 – base of financial отчетностей;
X2 – base of costs of actions;
X3 – base of models of prognostication of price of equities.
To the exits of the system
research and information system
belong:Y1 – result of analytical programmatic analysis.
Model
black box
system is shown in animation 1.
Figure 4.1 – Model of a black box of an information and analytical system. The drawing is animated, the number of repetitions is 10, the duration of one is 4 s, 4 frames, 104 KB
Conclusion
The row of the questions related to trade at the fund market is considered. A row over of facilities of technical analysis, by means of that can be made decision on the tosale of securities, was brought.
For period of the existence an exchange stock evolved from
places
trade inestablishments
to difficult, well equipped by the most modern computer facilitiessystems
trading in securities. Now mediators became the main participants of these trade operations on an exchange stock.In this division the concepts of exchange stock are considered in detail, a model structure over is brought. It is found out that a technical analysis is base on three statistical estimations of exchange trade, namely:
– prices;
– trade volumes;
– amount of open positions or open interest (open interest).
By the most popular instrument of technical analysts price charts. A construction of charts of price and courses change is one of the most ancient and most successful methods. Many the charts used by specialists for the exposure of market and points of fracture of trends tendencies.
Among facilities of technical analysis it is possible to distinguish four basic categories:
– standards of charts of prices;
– method of observance of trend;
– analysis of market character;
– cтруктурные theories.
List of the used sources
- Кини, Р. Д. Принятие решений при многих критериях : предпочтения и замещени / Р. Д. Кини, X. T. Райфа; [пер. с англ.]. – М. : Радио и связь, 1981. – 483 с.
- Павлов, В. И. Ценные бумаги в Украине : Учебное пособие / В. И. Павлов, И. И. Пилипенко, И. В. Кривовязюк. – М. : Кондор, 2004. – 400 c.
- Коупленд, T. Д. Стоимость компаний: оценка и управление / Т. Д. Коупленд, Т. Р. Коллер; [пер. с англ.]. – М. : ЗАО
Олимп Бизнес
, 2005. – 320 c. - Зайченко, Ю. П. Основы проектирования интеллектуальных систем Учебное пособие / Ю. П. Зайченко – К. : Слово, 2004. – 352 c.
- Асват, Д. Д. Инвестиционная оценка. Инструменты и техника оценки любых активов / Д. Д. Асват; [пер. с англ.]. – М. : Альпина Бизнес Букс, 2004. – 560 c.
- Анфилатов, В. С. Системный анализ в управлении / В. С. Анфилатов – М.: Финансы и статистика, 2009. – 368 c.
- Лефевр, Э. Н. Воспоминания биржевого спекулянта / Э. Н. Лефевр – М.: John Wiley and Sons, 2003. – 187 c.
- Данчева, В. В. Практическая психология в экономике и бизнесе : Учебное пособие / В. В. Данчева, Ю. М. Швалб. – М.: Либра, 1998. – 347 c.
- Колесников, В. Ю. Методы прогнозирования и анализ фондового рынка / В. Ю. Колесников, Т. В. Ванжа // Материалы студенческой секции IX Международной научно-технической конференции
Информатика управляющие системы, математическое и компьютерное моделирование
(ИУСМКМ – 2019). – Донецк: ДОННТУ, 2019. – С. 476-480 c.