
Abstract
contents
- Introduction
- 1. Relevance of the theme
- 2. Goal and tasks of the research
- 3. Formation of the coolant temperature
- 4. Development of a multi-level system of heat supply management
- Conclusion
- References
Introduction
The state of the housing and communal services in its current form beyond the power either for consumers of utility services, or for a budget system. Up to 50 percent of the budget is spent on some of the cities in the first heat of the housing stock. The thermal network in Ukraine are among the most expensive in the world. According to experts in heating and hot water mass construction of houses in Ukraine consumes twice as much energy than the developed countries with similar climatic conditions [5].
1. Relevance of the theme
This issue is relevant because of the shortage of energy resources, especially natural gas, which is currently the country buys at high enough rates. Therefore, it is necessary to optimize the operation of the heating system.
2. Goal and tasks of the research
The purpose of this paper is to maximize the reduction in fuel gas consumed heating system, maintaining an acceptable level of consumer comfort. Review of methods of reducing the flow of heat used by the heating system. Formation of the coolant temperature sufficient to heat the building, the heat consumer. Development of a multi-level system of heat supply management.
Main tasks of the research:
- Review of methods of reducing the flow of heat used by the heating system..
- Formation of the coolant temperature sufficient to heat the building, the heat consumer.
- Development of a multi-level system of heat supply management.
3. Formation of the coolant temperature
Based on a review of methods to reduce heat loss, it was decided to increase the efficiency of the automated heating system.
To solve this problem, first of all, you need to determine how to form the coolant temperature sufficient to heat the building Qт.oт.зд. are defined for this heat loss from inside the building. Heat flow Qт.пот.тр through the outer fence area Sн, the thermal resistance R0, at a room temperature tв and outside the building tнх are calculated according to the formula 1:
Qт.от.зд.=Sн*(tв-tнх)/R0 (1) [3]
Next calculated heat load on the system which are connected with heating into the room cold outdoor air for ventilation. The heat flow to heat outside air Qт.пн. calculated by the formula 2:
Qт.пн=Lп.н*pп.н*cp*(tв-tнх)/3.6 (2)
where pп.н – the average mass density of the heated air; cp Kg/m3=1 kJ/(kg*°C) – heat capacity of air, 3.6 – Conversion factor kJ in W/h Lп.н – filtered amount of outside air, m3/h [3].
In expression (2) is calculated heat consumption for heating outside air to room temperature. These costs warmth Qт.пн. also included in the calculation required thermal power heating systems. The results of the calculations is determined by the required heat output of the heating system of the building by the formula 3:
Qт.от.зд=Qт.пот.тр+Qт.пн (3) [3]
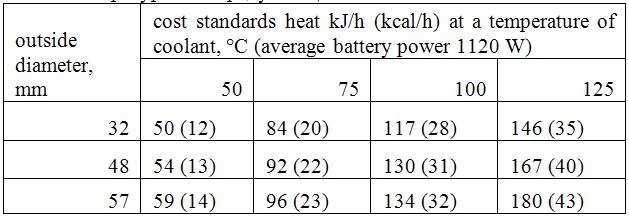
Next, using the table depending on the cost of heat and the pipe diameter determine the temperature of the coolant in the supply pipeline. For intermediate values of the input of heat temperature is interpolated.
Table 1 – Limits the input of heat pipes In mid premises with the design temperature of 20 °C [1]
4. Development of a multi-level system of heat supply management
What follows modify the structure of heat supply system to include new elements. To do this, we represent the entire heating system conventionally as three interrelated subsystems: subsystem of the chemical water treatment (CWT) and heating the coolant, the engine heat transmission and distribution to the consumer subsystem and remote monitoring and control parameters of the system [4].
Subsystem cwt and heating the coolant consists of the following subsystems:
The subsystem of heat transmission and distribution to the consumer consists of the following elements: valves, pipework, buildings, consumers, temperature sensors, controllers, actuators, electric multi-turn. In this system, the fuzzy controller regulates the valve pipeline building. Depending on the number of identity-home, in turn, contains information about the house, its thermal characteristics and differences of the actual and setpoint temperature of water in the return line fuzzy controller generates a control action – angle valves. Readings of water temperature in the return line of the building comes from the temperature sensor located in the feedback loop [4].
The subsystem supervisory control parameters of the system – a computer, comprising software to calculate and set the required parameters of regulation. Also in the computer database included all the information from the sensors to record and statistics [4].
Below clearly shows the interaction of all three subsystems (F. 1)
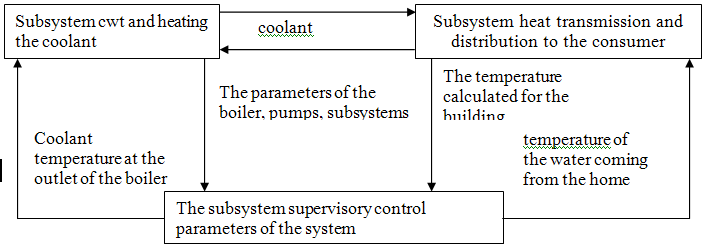
Figure 1 – The structure of a multi-level system of heat supply management
Figure 1 illustrates how the subsystem remote monitoring and control parameters of the system shall control the other two subsystems, it also communicates the heating system with the environment. Arrows shows the exchange of data between the subsystems [4].
Next, Figure 2 shows a network of heat in the form of a graph model whose vertices are the building-heat consumers, and the arcs represent a pipeline.
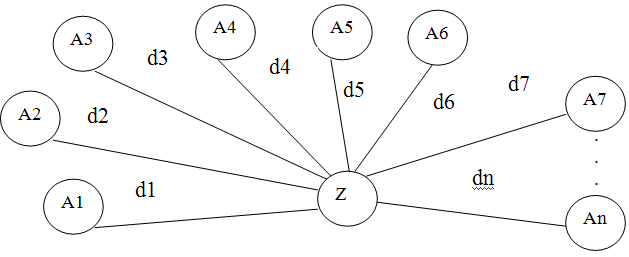
Figure 2 – The structure houses the heating system
The graph in Figure 2, consists of (n+1) nodes: Z={z} and А={а1 … аn}. The peak Z denotes a boiler room. This graph illustrates the relationship and buildings are heated by the boiler-heat customers. Boiler Room Z has such a parameter as the power of g, which determines the number of serviced buildings. Building-heat consumers represented by a set of vertices A. Elements ai є A characterized by the following attributes:
Set of edges of the graph D = {d1 … dn} denotes the pipe runs between buildings consuming and boiler room. Arc di є D are characterized by such attributes:
Conclusion
This article was developed by a multi-level structure of the automated control system for district heating of residential buildings, described procedures for the operation, the exchange of data between its components. This system can be used in centralized heating systems. System Unlike analogues based on principles of fuzzy logic, and can adjust the heat input to the building directly in front of it enters the carrier, thus eliminating unnecessary heat losses and increases the speed of leak detection in heating mains. Using subsystem supervisory control parameters of the system allows for automatic record keeping of data on the distribution of heat.
Note This master's work is not completed yet. Final completion: January 2014. The full text of the work and materials on the topic can be obtained from the author or his head after this date.
References
- Либерман Н.Б., Нянковская М.Т. Справочник по проектированию котельных установок систем централизованного теплоснабжения – Москва: «Энергия», 2005. –228 с.
- Варфоломеев Ю.М. Кокорин О.Я. Отопление и тепловые сети – Москва: «ИНФРА-М» 2008. –507 с.
- Соловьев Ю.П. Проектирование крупных центральных котельных для комплекса тепловых потребителей – Москва: 1976. –451 с.
- Многоуровневая система управления теплоснабжением жилых домов / Шушура А.Н., Звенигородский И.И.. // Информационные управляющие системы и компьютерный мониторинг (ИУС-2013) / Материалы II международной научно-технической конференции студентов, аспирантов и молодых ученых. – Донецк, ДонНТУ, том 1 с. 554−558. – 2013.
- Быстрицкий Г.Ф. Общая энергетика, 2005. –160с.
- Тихомиров К.В. Теплотехника, теплоснабжение и вентиляция. – М.; «Стройиздат», 2001. –248с.
- Нащокин В.В. Техническая термодинамика и теплопередача. – М.; «Высшая школа», 2008. –560с.
- Михеев М.А., Михеева И.М. Основы теплопередачи. – М.; «Энергия», 2007. –545с.