Abstract
Attention! At the time of writing this essay the master's work is not completed. The estimated completion date is May 2024. The full text of the work, as well as materials on the topic can be obtained from the author or his supervisor after the specified date.
Contents
- Introduction
- 1. Purpose and objectives of the study, planned results
- 2. Basic concepts and methods of multidimensional statistics
- 2.1 Factor analysis
- 2.2 Discriminant analysis
- 2.3 Cluster analysis
- 2.4 Multidimensional scaling
- 2.5 Quality control methods
- 3. Application of multidimensional statistical analysis in regional studies
- 4. Application of mathematical statistics methods to analyze the demographic situation in the DPR
- Conclusions
- References
Introduction
One of the key aspects of the development of modern states is effective governance territorial development. In a constantly changing economic, social and political environment, there is a need to conduct a multidimensional mathematical and statistical analysis of the development of regions in order to identify the main trends, regularities and identification of priority areas of development.
Multidimensional mathematical and statistical analysis is a set of methods and tools, allowing to investigate the relationship between various factors affecting the development of the region, and to determine the degree of their influence on key indicators. This makes it possible to identify the most promising regions and develop strategies for their development, as well as to determine priority areas for attracting investments and improving the quality of life of the population.
1. Purpose and objectives of the study, planned results
The purpose of this study is to conduct a multidimensional mathematical and statistical analysis development of regions to determine the main trends and patterns, as well as the development of recommendations for optimizing management territorial development and improvement of the quality of life of the population at the regional level.
2. Basic concepts and methods of multidimensional statistics
There are situations in which random variability was represented by one or two random values, signs. For example, when studying a statistical population of people, we are interested in height and weight. In this situation, no matter how many people are included in the statistical population, we can always make a scatter chart and see the whole picture. But if, for example, there are three signs, a sign is added — the age of a person, then the scattering diagram should be compiled in three-dimensional space. It is already quite difficult to imagine a set of points in three-dimensional space.
In fact, in practice, not every observation is represented by one, two or three numbers, but by some a visible set of numbers that describe dozens of characters. In this situation, in order to compile a scattering diagram, it would be necessary consider multidimensional spaces. Statistics section dedicated to the research of experiments with multidimensional observations, it is called multidimensional statistical analysis [1].
Measuring several features (properties of an object) at once in one experiment is generally more natural than measuring any one, two. Therefore, potentially multidimensional statistical analysis has a wide field of application.
Multidimensional statistical analysis includes the following sections:
- factor analysis;
- discriminant analysis;
- cluster analysis;
- multidimensional scaling;
- methods of quality control.
2.1 Factor analysis
In modern statistics, this method of data analysis is used to identify hidden factors, affecting the observed variables. The basic idea of factor analysis is that many variables can be reduced to a smaller number of factors that explain the main trends and the relationships between these variables.
Factor analysis can be applied in many fields, from economics and business to medical and psychological statistics. This method helps researchers determine which factors influence the observed variables and which variables are most sensitive to the effects of these factors.
One of the most important tasks that can be solved with the help of factor analysis is to identify the main factors influencing the change in indicators within a certain sample. In addition, factor analysis can be it is used to determine the relationships between various variables, as well as to predict the values of these variables, based on based on available data [2].
In general, factor analysis is a powerful tool that allows researchers to more deeply and accurately study the relationships between different variables, identify hidden factors and create more accurate models for predicting the future values of these variables.
The main idea of factor analysis is to identify the most important and significant factors in the set variables with similar characteristics.
To understand factor analysis, it is necessary to know the basic concepts and definitions that are part of it theoretical apparatus. The most important of them are the concepts of factor, factor load, utility, internal value, factor space.
A factor is a kind of hidden variable that explains the relationship between a set of variables. The factors may be different, for example, in medical statistics, diseases can act as factors, in economics – the parameters of economic activity, and in sociology – social facts. With the help of factor analysis, it is possible to identify the most significant factors that have the greatest correlation with the data set and explain the largest part of the variability.
Factor load is a coefficient that shows how strongly each indicator affects a given factor. Factorial the load can be positive or negative, which indicates the direction of influence. The higher the factor load, the a specific indicator plays an important role in the formation of this factor.
Utility is a coefficient that shows how much a single indicator is explained by a common factor. Utilities it is close to one if the variable is a good representative of this factor. The closer the utility is to zero, the weaker relation of this variable to the general factor [3].
An eigenvalue is a value that reflects how important a factor can be isolated from a data set. Proper number it is calculated based on eigenvectors, and the higher this number, the more important the corresponding factor.
A factor space is a multidimensional space in which each variable is represented by a factor. Factorial the space shows how strong the correlation is between different indicators, and allows you to see which variables they are closer to each other and which ones are further away.
The principle of factor analysis is that a data matrix is analyzed, where each column represents a variable, and each row is an observation.
Within the framework of factor analysis, variables are grouped by similarity and factorized, that is, they are separated based on common properties, which are present in their correlation structure. With the help of factor analysis, it is possible to identify dependencies between variables and determine which of them are the most significant, and which do not affect the overall picture.
The results of factor analysis can be the main components, which are a combination of the initial variables, and also their weight coefficients. The main goal of factor analysis is to reduce the number of variables, minimize intersections between them and identify the real distinguishing features of the data set.
2.2 Discriminant analysis
Suppose there is a collection of objects, divided into several groups, and for each object it is possible to determine which group it belongs to concern. For each object there are measurements of several quantitative characteristics. It is necessary to find a way how to based on these characteristics, you can find out the group to which the object belongs. This will allow you to specify the groups that include new objects of the same population. Discriminant analysis methods are used to solve this problem.
Discriminant analysis is a section of statistics, the content of which is the development of methods for solving discrimination problems (discrimination) of objects of observation on certain grounds.
Discriminant analysis turns out to be convenient when processing the test results of individuals when it comes to admission to this or that position. In this case, it is necessary to divide all candidates into two groups: suitable and not suitable [4].
The use of discriminant analysis is possible by the banking administration to assess the financial state of clients when granting them a loan. The Bank classifies them into reliable and unreliable on a number of grounds.
Discriminant analysis can be used as a method of dividing a set of enterprises into several homogeneous groups according to the values of any indicators of production and economic activity.
The methods of discriminant analysis allow us to construct functions of the measured characteristics, the values of which explain the partition objects into groups. It is desirable that there are few of these functions (discriminant features). In this case, the results of the analysis it is easier to interpret meaningfully.
Due to its simplicity, linear discriminant analysis plays a special role, in which classifying features are selected as linear functions of primary features.
2.3 Cluster analysis
Cluster analysis methods allow you to divide the studied set of objects into groups of "similar" objects, called clusters. The word cluster of English origin — cluster translates as brush, bundle, group, swarm, cluster.
Cluster analysis solves the following tasks:
- Classifies objects taking into account all those features that characterize object. The very possibility of classification advances us to a more in-depth understanding of the considered totality and objects, included in it.
- Sets the task of checking the presence of a priori given structure or classification in available aggregate. Such a check makes it possible to use the standard hypothetical-deductive scheme of scientific research.
Most clustering (hierarchical group) methods are agglomerative (unifying) — they start with the creation of elementary clusters, each of which consists of exactly one initial observation (one point), and at each subsequent step the two closest clusters are combined into one [5].
The moment of stopping this process can be set by the researcher (for example, by specifying the required number of clusters or the maximum distance at which the union is achieved).A graphical representation of the cluster merging process can be obtained using a dendrogram — a cluster union tree.
2.4 Multidimensional scaling
Multidimensional Scaling (MDS) is a statistical method that is used to analyze and visualize data based on comparative estimates or similarities between objects. It allows you to represent multidimensional data in the form of a geometric structure in a smaller space.
The main idea of the multidimensional scaling method is to find a mapping (transformation) that preserves relative distances or similarities between objects. Thus, more similar objects will be located closer to each other, and less similar objects will be located further from each other. The multidimensional scaling method can be used for various types of data, such as estimates of similarity between products, estimates of consumer preferences, results of psychological tests and It is widely used in various fields, including marketing, sociology, psychology, biology and others.
The basic principle of the multidimensional scaling method is to preserve the relative distances between objects. This means that if two objects are more similar to each other, then they should be located closer to each other than objects that less similar. Thus, the method seeks to preserve the structure of the source data in a space of smaller dimension.
2.5 Quality control methods
Quality control methods are designed to control the quality of manufactured products in order to identify violations and "bottlenecks" in organization of production and technological processes. Widespread use of scientifically based quality control methods It was an important factor in the success of the leading countries of the world economy, especially Japan.
Recently, new methods of more effective management in order to improve quality have been called "six sigma". They they are considered as a formula for the success of most multinational corporations [7]. Unlike most the methods of multidimensional analysis described above, quality control methods do not require time—consuming calculations - they are extremely simple and visual. The simplicity, visibility and effectiveness of statistical methods of quality control made it possible and justified their widespread use in advanced countries, up to craftsmen, and sometimes individual workers.
3. Application of multidimensional statistical analysis in regional studies
Multidimensional statistical analysis is used in regional studies to study the relationship of various factors, influencing the development of the region. For example, you can study the relationship between the level of economic development of the region and the level of education of the population, between the level of unemployment and the level of crime, between the level of investment and the level of development infrastructure, etc.
Multidimensional statistical analysis can also be used to classify regions according to various criteria, such as the level of economic development, the level of social tension, the level of environmental safety, etc. This allows you to identify the most problematic regions and develop measures to support and develop them.
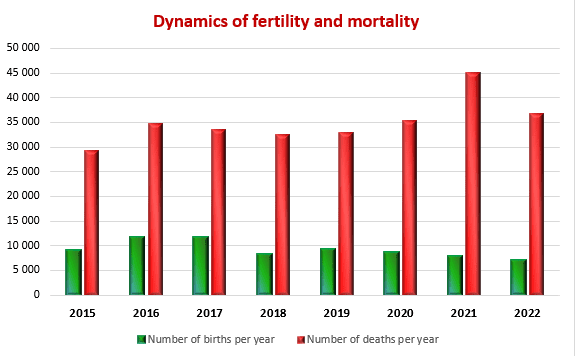
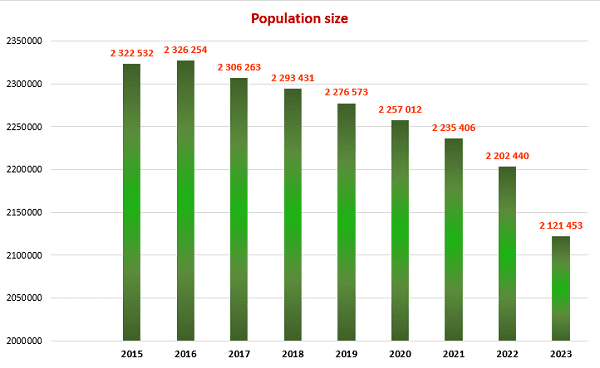
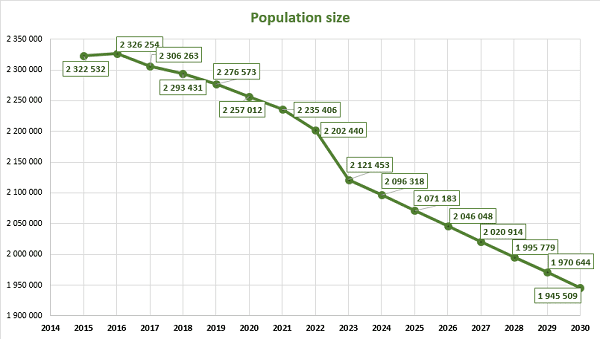
4. Application of mathematical statistics methods to analyze the demographic situation in the DPR
The most important indicators of public health in any country are demographic indicators that characterize stability and security, as well as prospects for its further development.
In this context, the analysis of the demographic situation using the methods of mathematical statistics becomes especially relevant. After all, this approach allows us to obtain the most accurate and objective data on the state of the population, its structure and the dynamics of changes.
One of the key tools of mathematical statistics is the analysis of time series, which allows you to identify trends and patterns in changing demographic indicators. Modeling and forecasting methods are also used, allowing predict possible scenarios for the development of the demographic situation [8-10].
In general, the use of mathematical statistics methods allows us to gain a deeper understanding of demographic processes and make informed decisions in the field of social policy, healthcare and other areas related to public health and the well-being of the population.