| |||||||||||||||||||||||||||||||||||||||||||||||||||||||||||||||||||||||||||||||||||||||||||||||||||||||||||||||||||||||||||||||||||||||||||||||||
| |||||||||||||||||||||||||||||||||||||||||||||||||||||||||||||||||||||||||||||||||||||||||||||||||||||||||||||||||||||||||||||||||||||||||||||||||
| main | biography | abstract | library | links | search rezult | individual task | |||||||||||||||||||||||||||||||||||||||||||||||||||||||||||||||||||||||||||||||||||||||||||||||||||||||||||||||||||||||||||||||||||||||||||||||||
|
The theme: "Automation System of the access control based on fingerprints identification".
Introduction. Importance. Novelty
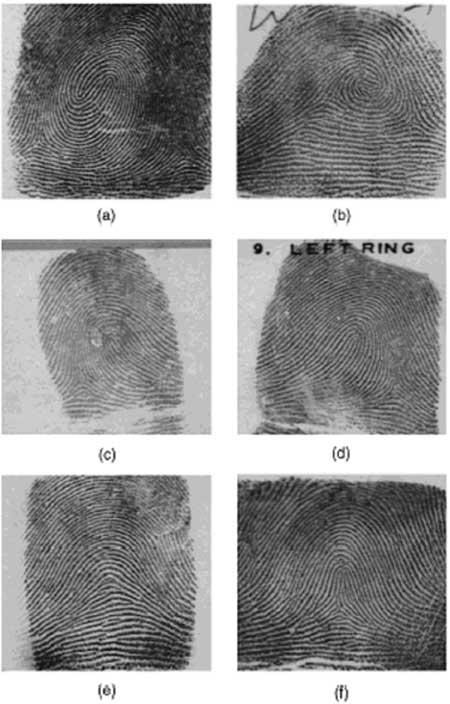
1) model-based. The model-based fingerprint classification technique uses the locations of singular points (core and delta) to classify a fingerprint into the five above-mentioned classes. A model-based approach tries to capture the knowledge of a human expert by deriving rules for each category by handconstructing the models and therefore, does not require training. Accuracies of 85 percent and 87.5 percent have been reported on the NIST-4 database using these approaches. 2) structure-based. A structure-based approach uses the estimated orientation field in a fingerprint image to classify the fingerprint into one of the five classes. An accuracy of 90.2 percent with 10 percent rejection is reported on NIST-4. The neural network used in was trained on images from 2,000 fingers (one image per finger) and then tested on an independent set of 2,000 images taken from the same fingers. The error reported is, thus, optimistically biased. A later version of this algorithm was tested on the NIST-14 database, which is a naturally distributed database, resulting in a better performance. However, this performance improvement should be expected since the NIST-14 database contains only a small percentage of arch-type fingerprints, which pose the most difficulty for fingerprint classifiers and the neural network used in the algorithm implicitly takes advantage of this information. A similar structure-based approach, which uses hidden Markov models for classification, depends on a reliable estimation of ridge locations, which is difficult in noisy images. In another structure-based approach, B-spline curves are used to represent and classify fingerprints. 3) frequency-based. Frequency-based approaches use the frequency spectrum of the fingerprints for classification. 4) syntactic. A syntactic approach uses a formal grammar to represent and classify fingerprints. 5) hybrid approaches. Hybrid approaches combine two or more approaches for classification. These approaches show some promise but have not been tested on large databases. For example, Chong et al. report results on 89 fingerprints, Fitz and Green on 40 fingerprints, and Kawagoe and Tojo on 94 fingerprints.
The K-nearest neighbor classifier results in an accuracy of 85.4 percent for the five-class classification task when 10 nearest neighbors (K = 10) are considered. Classification accuracy does not always increase with increasing K; there exists an optimal value of K for finite training sample size classification problems. For the four-class classification task (where classes A and T were collapsed into one class), an accuracy of 91.5 percent is achieved. The confusion matrix for the K-nearest neighbor classification is shown in table 2.1.
Table 2.1 Confusion matrix for the K-nearest neighbor classification; K = 10 The diagonal entries in this matrix show the number of test patterns from different classes which are correctly classified. Since a number of fingerprints in the NIST-4 database are labeled as belonging to two different classes, row sums of the confusion matrices in Tables 1, 2, and 3 are not identical. 2. Neural Network Classifier We trained a multilayer feed-forward neural network using a quick propagation training algorithm. The neural network has one hidden layer with 20 neurons, 192 input neurons, and five output neurons corresponding to the five classes. We obtain an accuracy of 86.4 percent for the five-class classification task. For the four-class classification task, an accuracy of 92.1 percent is achieved. The confusion matrix for the neural network classification is shown in table 2.2.
Table 2.2 Confusion matrix for the Neural Network Classifier 3. Two-Stage Classifier The objective here is to perform a "simple" classification task using a K-NN classifier and then use a bank of two-class neural network classifiers to handle more subtle discriminations. The first stage uses the K-nearest neighbor (K = 10) classifier to yield the two most probable classes. We observed that 85.4 percent of the time, the class with the maximum frequency among the K nearest neighbors is the correct class and 12.6 percent of the time, the class with the second highest frequency is the correct class. In other words, the K-nearest neighbor classifier yields the top two classes with an accuracy of 98 percent. This result itself can be used to accurately classify fingerprints into two out of the five classes. Each fingerprint will have an entry in two of the five partitions of the database and the matching is required to be performed only in the corresponding two partitions of the database. The second stage uses 10 different neural networks for 10 different pairwise classifications. These neural networks have 192 input neurons, 20-40 hidden neurons in one hidden layer, and 2 output neurons. Each neural network is trained using the patterns from only the two corresponding classes in the training set. For example, the neural network which distinguishes between R and W is trained using only the patterns labeled R and W in the training set. This two-stage classifier yields an accuracy of 90 percent for the five-class classification task and an accuracy of 94.8 percent is achieved for the four-class classification task. The confusion matrix for the two-stage classification is shown in table 2.3.
Table 2.3 Confusion matrix for the Two-Stage Classifier Although our classifier is robust to noise and is able to correctly classify most of the poor quality fingerprints in the NIST-4 database, it fails on some very bad quality fingerprint images where no ridge information is present in the central part of the fingerprint. In poor quality fingerprints, it is very difficult to detect the center point correctly. Our classifier also fails to correctly classify twin loop images which are labeled as whorl in the NIST-4 database. For these images, our center location algorithm picks up the upper core and on considering that as the center, the image looks like a loop in the region of interest which leads to a misclassification of W as L or R. About 3 percent of the errors result from loop-arch misclassification because of the subtle difference between loop and arch types. The A-T misclassification accounts for about 5 percent of the errors. 4. Reject Option Classification accuracies can be further increased by incorporating a rejection option. We use the (K, K')-nearest neighbor classifier for rejection and the proposed two-stage classifier for classification. If the number of training samples from the majority class among the K nearest neighbors of a test pattern is less than K' (K' < K), we reject the test pattern and do not attempt to classify it. Most of the rejected images using this scheme are of poor quality. Other rejected images are those images which "appear" to belong to different classes. For example, for the fingerprint image, three of its nearest neighbors belong to class R, three to class A, and four to class T. By rejecting 19.5 percent of the images for the five-class problem, the classification accuracy can be increased to 93.5 percent and for the four-class classification problem, the accuracy can be increased to 96.6 percent (table 2.4).
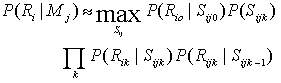
Table 2.4 Error-reject trade-off 5. Hidden Markov Model Classifier Hidden Markov models are a form of stochastic finite state automaton well-suited to pattern recognition and success fully applied to speech recognition [15], [16] and other problems. They are appropriate to the problem posed here because of their ability to classify patterns based on a large quantity of features whose number is variable and which have certain types of underlying structure, especially if that structure results in stationarity of the feature distributions over some spatial or temporal period. In a fingerprint, the basic class information can be inferred from syntactic analysis of singular points, but can also be seen in the general pattern of the ridges-the way a nonexpert human would classify prints. The HMM is able to statistically model the different structures of the ridge patterns by accumulations of evidence across the whole print, without relying on singular point extraction. Thinning the ridge image so that each ridge is left represented by an eight-connected, one-pixel-wide line termed the skeleton. Given the skeleton image of the ridges, parallel fiducial lines are laid across the image at an angle ф, and each one followed in turn. For each intersection of a fiducial line with a ridge, a feature is generated. Each feature consists of a number of measurements, chosen to characterize the ridge behavior and its development at the intersection point. The measurements of each feature are termed a frame and the frames, Rik for the i-th fiducial line are collectively termed a row, Ri, whose ordering is preserved. For each orientation ф of fiducial lines, a separate representation Rф={Ri,Vi} of the print is obtained. In this research, only horizontal and vertical lines have been used, giving features Rh and Rv, respectively, but other angles may allow further information to be captured. Typically, HMMs are one-dimensional structures suitable for analyzing temporal data. Here, the data are two-dimensional, but the process of feature extraction can also be described as a one-dimension alarray of one-dimensional row processes. For classification, a model Mc is constructed for each class, c, and the maximum likelihood class is chosen after calculating the probability of the data R given the model: argmaxcP(R| Mc). The frame emission probabilities are modeled with mixtures of diagonal covariance, multivariate Gaussian distributions. Thus, for any frame Rik, it is possible to calculate the likelihood P(Rik|Sijk) of it occurring in any state Sijk. With these likelihoods, for any row model, the likelihood of any row can be approximated by the maximum likelihood of any state sequence aligning the features and states calculated as a product of frame likelihoods and transition probabilities for the state sequence:
For each orientation of fiducial lines, a separate classifier can be made. Since the errors of the different classifiers will be different, a combination of their scores may yield better accuracy. Denoting by Mhc, Mvc, the class c models trained with vertical and horizontal features, respectively, and assuming independence, the likelihood of the data is written as:
6. Decision Tree Classifier Such decision, trees are built using techniques based upon those of Amit et al. These authors tackled a number of problems including that of digit recognition-classifying images of the digits '0' to '9.' The technique used by Amit et al. for constructing decision trees involves the generation of a large number of simple features. Each feature in isolation provides little information about the classification decision, for example, the existence of an edge at a particular location in an image may give little clue as to the digit's identity. However, combinations of such features can represent much important information needed to make an accurate classification decision. Amit et al. describe a procedure for making decision trees by growing questions based upon such combinations of simple features. The procedure has been adopted here for fingerprint classification and involves an initial feature extraction phase, followed by question building which creates informative questions assisting in classification. These complex questions are combined in a hierarchical manner to form decision trees which are used for classification. Because the trees are constructed stochastically, trees constructed for the same problem have different performances and, as is common with decision tree classifiers, multiple trees are combined to give the final classification.
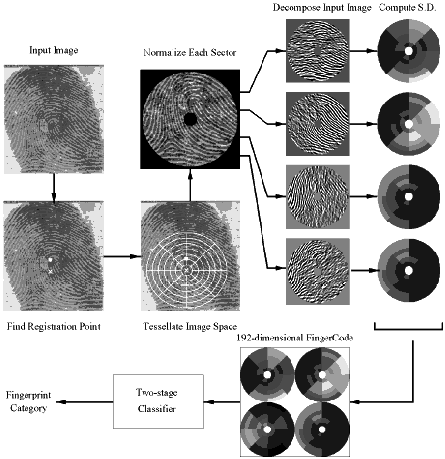
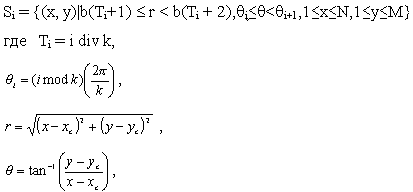
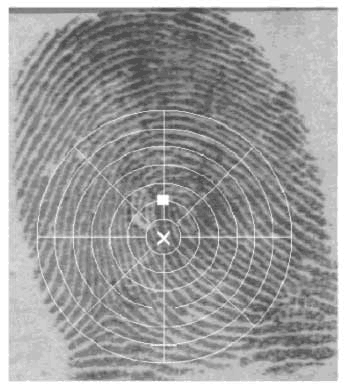
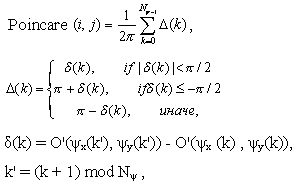
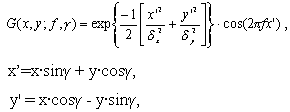
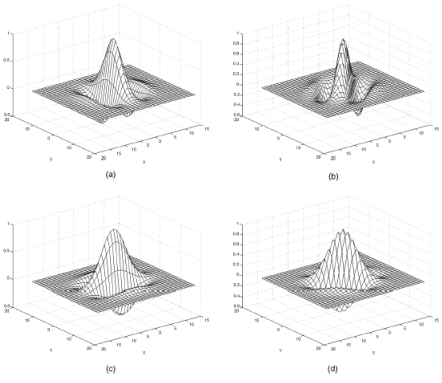
The category of a fingerprint is determined by its global ridge and furrow structures. A valid feature set for finger-print classification should be able to capture this global information effectively. We have developed a novel representation scheme (FingerCode) which is able to represent both the minute details and the global ridge and furrow structures of a fingerprint. For the purpose of classification, we use a low-level representation which is very effective in representing the global ridge and furrow structures and which is invariant to individual minute details. The main steps of our feature extraction algorithm are as follows: 1) Find a registration point (center point) and define a spatial tessellation of the image space around the registration point (represented by a collection of sectors). 2) Decompose the input image into a set of component images, which preserve global ridge and furrow structures. 3) Compute the standard deviation of gray level values in each sector to form the feature vector or the FingerCode. Let I(x, y) denote the gray level at pixel (x, y) in an M x N fingerprint image and let (xc, yc) denote the center point. The spatial tessellation of the image space which consists of the region of interest is defined by a collection of sectors Si, where the ith sector Si is computed in terms of parameters (r, The main steps of our classification algorithm are as follows (Fig.2.6): 1) Locate a registration point in the input image and define a spatial tessellation of the region around the registration point (sectors). Any point that can be consistently detected in a fingerprint image can be used as a registration point (or center point because we prefer this point to be positioned at the center of the image). In a fingerprint image, the core point presents such a consistent point. Therefore, in our algorithm, we define core point as the center point (xc, yc). We used the core point detection algorithm which is presented below. a) Estimate the orientation field O using the least square orientation estimation algorithm. Orientation field O is defined as an N x N image, where O(i, j) represents the local ridge orientation at pixel (i, j). An image is divided into a set of w x w nonoverlapping windows and a single local orientation is defined for each window. b) Smooth the orientation field in a local neighborhood. Let the smoothed orientation field be represented as O'. c) Initialize A, a label image used to indicate the core point. d) For each pixel (i, j) in O', compute the Poincare index and assign the corresponding pixels in A a value of one if the Poincare index is (1/2). The Poincare index at pixel (i, j) enclosed by a digital curve, which consists of a sequence of pixels that are on or within a distance of one pixel apart from the corresponding curve, is computed as follows:
e) Find the connected components in A. If the area of a connected component is larger than seven, a core is detected at the centroid of the connected component. If the area of a connected component is larger than 20, two cores are detected at the centroid of the connected component. f) If more than two cores are detected, go back to Step 2. g) If two cores are detected, the center is assigned the coordinates of the core point with the lower y value (the upper core). If only one core is detected, the center is assigned the coordinates of the core point. h) If no core point is detected, compute the covariance matrix of the vector field in a local neighborhood (q x q) of each point in the orientation field. Define a feature image I with the largest eigenvalue of the covariance matrix for each element in the orientation image. A core is detected at the centroid of the largest connected component in the thresholded image of F and the center is assigned the coordinates of the core. The center found above is shifted 40 pixels down for further processing based on the fact that most of the category information in a fingerprint lies in the lower part of the fingerprint. This value was empirically determined. 2) Decompose the input image into a set of component images, each of which preserves certain ridge structures; compute the standard deviation of the component images in each sector to generate the feature vector (called FingerCode). Gabor filters are band-pass filters which have both orientation-selective and frequency-selective properties and have optimal joint resolution in both spatial and frequency domains. By applying properly tuned Gabor filters to a fingerprint image, the true ridge and fur row structures can be greatly accentuated. These accentuated ridges and furrow structures constitute an efficient representation of a fingerprint image. An even symmetric Gabor filter has the following general form in the spatial domain:
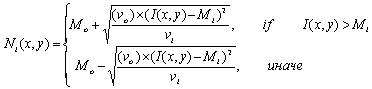
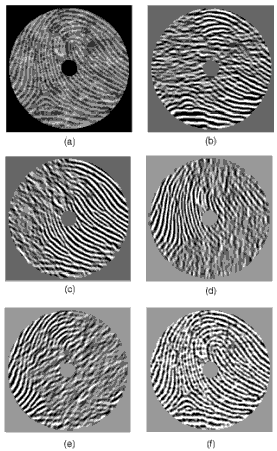
In our algorithm, the filter frequency f is set to the average ridge frequency (1/K), where K is the interridge distance. The average interridge distance is approximately 10 pixels in a 500 dpi fingerprint image. The values of A fingerprint image is decomposed into four component images corresponding to four different values of Before decomposing the fingerprint image, we normalize the region of interest in each sector separately to a constant mean and variance. Normalization is done to remove the effects of sensor noise and finger pressure differences. Let I(x, y) denote the gray value at pixel (x, y), Mi and Vi, the estimated mean and variance of sector Si, respectively, and Ni(x, y), the normalized gray-level value at pixel (x, y). For all the pixels in sector Si, the normalized image is defined as:
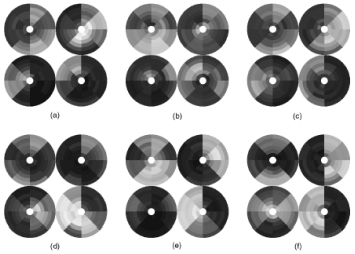
Normalization is a pixel-wise operation which does not change the clarity of the ridge and furrow structures. For our experiments, we set both M0 and V0 to a value of 100. Normalized, filtered, and reconstructed images for the fingerprint are shown in Fig. 2.9.
3) Feed the feature vector into a classifier; in our algorithm, a two-stage classifier is used. This two-stage classifier uses a K-nearest neighbor classifier in its first stage and a set of neural network classifiers in its second stage to classify a feature vector into one of the five fingerprint classes. In each component image, a local neighborhood with ridges and furrows that are parallel to the corresponding filter direction exhibits a higher variation, whereas a local neighborhood with ridges and furrows that are not parallel to the corresponding filter tends to be diminished by the filter which results in a lower variation. The spatial distribution of the variations in local neighborhoods of the component images thus constitutes a characterization of the global ridge structures and is well captured by the standard deviation of grayscale values. In our algorithm, the standard deviation within the sectors defines the feature vector. Let | |||||||||||||||||||||||||||||||||||||||||||||||||||||||||||||||||||||||||||||||||||||||||||||||||||||||||||||||||||||||||||||||||||||||||||||||||
| main | biography | abstract | library | links | search rezult | individual task | |||||||||||||||||||||||||||||||||||||||||||||||||||||||||||||||||||||||||||||||||||||||||||||||||||||||||||||||||||||||||||||||||||||||||||||||||