
Anton Lyashko
Faculty: Computing Engineering and Informatics
Speciality: Economic cybernetics
Theme of master's work:
Working descriptions of indicators using synthetic moving average
|
|
Anton Lyashko Faculty: Computing Engineering and Informatics Speciality: Economic cybernetics Theme of master's work: Working descriptions of indicators using synthetic moving average Scientific adviser: Alexander Smirnov |
DonNTU
Master's portal |
| About author |
Summary of research and developments
INTRODUCTION
During the last decade traders and researchers have been continuously trying to find the most reliable way to forecast the further asset behavior. As a result today many methods of fundamental and technical analysis have appeared and there are many theories that really work well. This graduation work studies one of the ways of a technical analysis – a synthetic moving average.
The actuality of any stock theme consists in the fact that traders deals in our country are still not available to the great mass of the population. As a rule, stock sales are carried out at the government or transnational corporations level and the article of trade is usually a huge amount of some good.
As for the actuality of the graduation work theme it consists in finding and improvement of new methods of technical analysis in order to get the most reliable forecasts. At the present research stage technical analysis does not dispose of any other better instruments.
A scientific relevance of the work consists in the improvement of the technical analysis theoretical basis which makes possible the further science advance and knowledge spreading among all levels of the population. So, the more work will be carried out in this sphere, the more informed the interested persons may be.
The practical aspects of any activity are always connected with the theoretical ones. A good awareness in theoretical issues of the stock exchange activity may encourage people to put this knowledge into practice. So, the practical value of the analysis of the synthetic moving average consists in the effectiveness increase in sales at the expense of the quality improvement of the anticipated expectations.
The main result of work is a comparative analysis of old and new moving averages and also optimal parameters of the synthetic moving averages calculated on the basis of currency quotation sample for some period of time. The disadvantages of the traditional moving averages will be also identified at the end of research and relying on this data the effectiveness of new moving averages will be concluded.
The effectiveness assessment of the selected parameters for the synthetic moving averages will be based on the following figures:
1. An average profitableness of all bargains: Dav
2. An average quadratic deviation (σ)
3. Sharp coefficient:
Kш = (Dср-r*S)/ σ
r – deposit percent rate
S – capital sum
4. TWR coefficient
TWR = Dav/S
5. Profit factor (РF ):
PF = К1*К2
К1 – it is a ratio of average profits to average losses during the base period
K1 = (P/Кp) / (L/КL)
K2 – it is a ratio of number of profitable bargains to their total amount during the base period
К2=Кp/Кtot
P – total profits during the
base period
L – total losses during the base period
Kp – a number of profitable bargains during the base period
Klos – a number of unprofitable bargains during the base period
Ktot = Kp + Klos – a total number of bargains during the base period
WORKING RESULTS BY THE TIME OF WRITING THE AUTOREPORT
Moving averages are referred to be the most popular instruments of the technical analysis. At the same time they have some disadvantages. They are as follows:
1. A
delay in moving averages with regard to price graphs by m/2, where m is a figure
of a moving average temporary gap
2. High variability of the chosen trends, that does not decrease significantly
when m figure goes up
3. Averaging – out non – linear trends moving averages highlight not real trends
but their linearized models (as a result some removals appear).
In order to eliminate these disadvantages fully or partially synthetic moving averages were developed.
A synthetic moving average with the parameters (16,16) provides some more signals then SMA (16,4). It is connected with the fact that SMA (16,4) fluctuation range is smaller then that of SMA (16,16) and it does not often cross with a price graph.
There are profitability graphs for SMA(16,16) and SMA (16,4) I the pictures 1 and 2. The initial capital is 100000$.
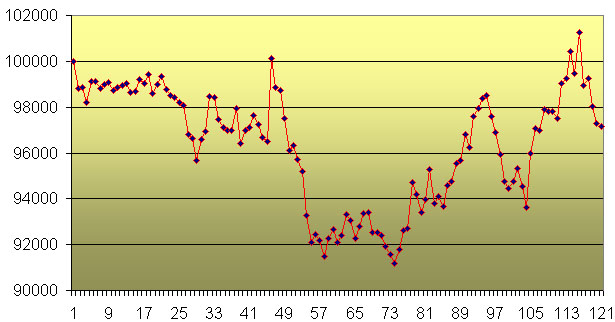
Picture 1 - Profitability graph SMA(16, 4)
The aggregate result is a loss of 2850$. The number of deals is 121. So, if the transaction costs had not been zero, the loss would have grown significantly. As we can see from the picture 2 SMA (16,16)provides a higher income while the number of deals is 148.
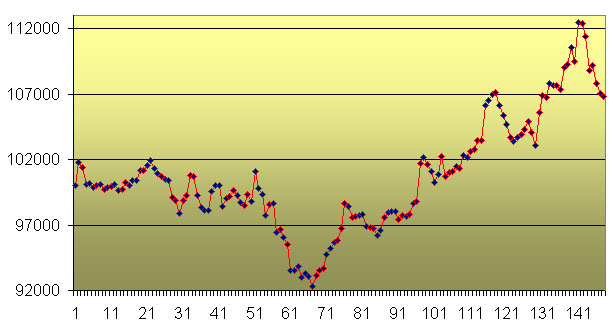
Picture 2 - Profitability graph SMA(16, 16)
The total income is 6850$. But if take transaction costs into the account, income can fall considerably.
CONCLUSION
Technical analysis is a generally accepted method of assets estimation and identifying the future price direction using either graphical patterns and mathematic indicators or their combination. But each of this methods may be proficient not in every case. It means that there are no universal indicators in the technical analysis. It is a reason why so often new modifications of old indexes appear. For example, a synthetic moving average is a modified exponential moving average. It is quite possible that in the future there will be a perfect indicator, but today we can only modify the methods by combining them.
LIST OF LITERATURE
1. Швагер Дж. Технический анализ. Полный курс. - М.: Альпина Паблишер, 2001. - 768 с.
2. Смирнов А.В. Технический анализ рынков. Методические указания и задания по курсу. – Донецк: ДонНТУ, 2003. - 30 с.
3. Смирнов А., Тихонова О. Секрет Марка Джурика раскрыт? Статья. - Журнал: Валютный спекулянт, 2006.
4. Таран В.А. Играть на бирже просто?! - М.: Питер, 2008. – 370 с.
5. Смирнов А.В., Ревега Д.В. Синтетические скользящие средние. Статья. - Донецк: ДонНТУ, 2004.
6. Электронный конспект лекций по FOREX. (http://www.trader-lib.ru/books/500/)
7. Акелис С.Б. Технический анализ от «А» до «Я». Пер. с англ. – М.: Диаграмма, 1999. - 234с.
8. Акимочкин А.В. Разработка и исследование адаптивных торговых систем, инвариантных к изменениям рыночной ситуации. Автореферат магистерской диссертации. - Донецк: ДонНТУ, 2008. (http://masters.donntu.ru/2008/fvti/akimochkin/diss/index.htm)
9. Элдер А. Как играть и выигрывать на бирже. Пер. с англ. – М.: Диаграмма, 2001. - 352 с.
10. Статья FOREX. Виды скользящих средних. (http://www.forekc.ru/948/index_108.htm)