Introduction
Presently Ukraine is rapidly integrated in world trade organizations, it’s isolation in this plan is conditioned by the low rates of economic growth. The main part of world trade is carried out by means of exchange, as a result researches in the field are very actual and extremely necessary for Ukraine.Objectivity and necessity of researches in technical analysis of market’s conduct field and it’s prognostication is conditioned by the swift exchange market development in Ukraine, by growth of its meaningfulness in development of country’s economy and by the further prospects.
The object of the conducted research is a development of original indicator for exchange price graphs analysis on the basis of sliding correlation analysis with estimation of its current reliability.
1 Task setting
On the basis of the real data of Forex market (rate of exchange EUR/USD for period from January 2002 to May 2003) an algorithm of original indicator is developed with use of estimation of values of sliding autocorrelation of the explored price graph for different time intervals (m = 5; 10; 21) with lag k = 1, 2, 10.2 Autocorrelative indicator construction algorithm
1. To take rate of exchange EUR/USD for the period from a 10.05.02 to 13.09.02.2. To build the price graph and define turn points.
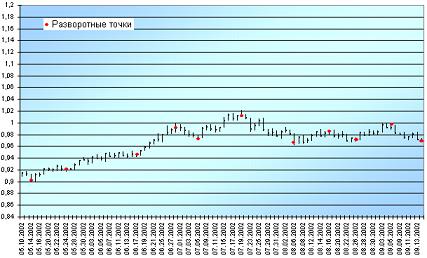
Figure 1 - The price graph (H, L, C) |
Turn points are points, in which a “break” of market occurs, i.e. it begins to move in other direction. At this juncture it is necessary to carry out either purchase, or sale.
In order to define strategy of trader’s conduct in the turn points it is necessary to realize the points 3-4 of indicator construction algorithm.
3. To calculate moving autocorrelation function in time intervals of m = 5; 10; 21 with lag k = 1, 2.10 and to make their graphs.
4. To choose for every time interval the most informing lags values , based on the following rule: at the price graph’s positioning in the turn points autocorrelation must take on values in range from -0,4 to 0,4.
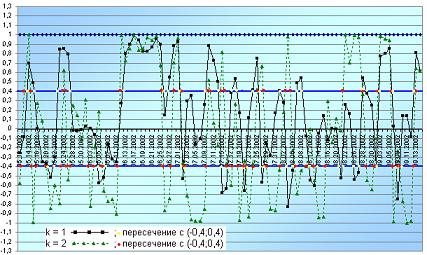
Figure 2 - Autocorrelation function for the time interval of m = 5 |
On the graph the field (-0,4; 0,4) is selected, which is intended to cast aside the insignificant vibrations of the market and take into account those “turns” only, in accordance with which a trader should make his conduct strategy .
We make trade signals for the given price graph. Results of calculation are shown on the picture 3.
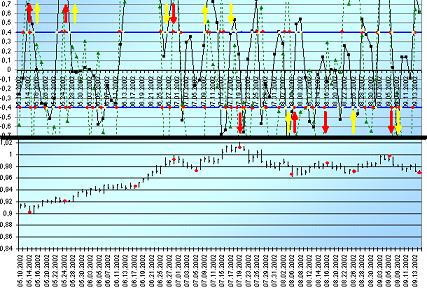
Figure 3 - Handling signals construction |
On the graph two types of signals are presented: purchase and sale. In case if the price graph grows and a turn point coincides with intersection of the autocorrelation function with field (-0,4; 0,4), a handling signal will be – to buy; in case if the price graph falls and a turn point coincides with intersection autocorrelation function with field (-0,4; 0,4), a handling signal will be – to sell.
3 Calculation results
After handling signals construction for the autocorrelation functions with different time intervals the following results are found:1. At the time interval of m = 5 most informing lag is k = 1. In this case probability of correct recognition of market turns made P correct = 0,24, and P slip = 0,76.
2. At the time interval of m = 10 most informing lag is k = 2. In this case probability of correct recognition of market turns made P correct = 0,46, and P slip = 0,54.
3. At the time interval of m = 21 most informing lag is k = 1. In this case probability of correct recognition of market turns made P correct = 0,63, and P slip = 0,37.
Probability of correct recognition of market turns (P correct ) is calculated as a relation of quantity of handling signals to the quantity of autocorrelation function crossing with the field (-0,4; 0,4).
Probability of wrong recognition of market turns (P slip ) is calculated as: 1 – P correct
4 Auxiliary indicator
For the purpose of estimation of handling signals reliability an auxiliary indicator is made, characterizing a size of sliding maximal interval of autocorrelation: the larger it is, the less trend fluctuates and the more handling signal is reliable. The given indicator is calibrated directly in the values of probability by the following rules:1) for the time interval of m = 5 in the turn points the sum of values of correlation function is on interval:
- less than 1,1: probability P = 0,2;
- from 1,1 about 1,5: probability P = 0,6;
- more than 1,5: probability P = 0,9.
- less than 1,5: probability P = 0,2;
- from 1,5 about 2,5: probability P = 0,5;
- from 2,5 about 3,5: probability P = 0,7;
- more than 3,5: probability P = 0,9.
- less than 1,5: probability P = 0,2;
- from 1,5 about 3: probability P = 0,5;
- from 3 about 5: probability P = 0,7;
- more than 5: probability P = 0,9.
Examples of auxiliary indicator calculation will be shown after ending of work.
Conclusions
As a result of the done work theoretical bases of technical analysis and variety of indicators (trend indicators, oscillators and auxiliary indicators) were considered and studied in detail. Besides this an original autocorrelative indicator is offered, authenticity of handling signals of which is estimated by the auxiliary indicator.On the basis of the calculations done it is possible to draw the following practical conclusions:
1. An autocorrelative indicator at the analysis of turn points at the Forex market (rate of exchange EUR/USD) has shown its fitness for forming in the trade systems of reliable handling signals.
2. An autocorrelative indicator is the most informing at the use of time interval of m = 21 with lag equal 1.
3. With growth of time interval the probability of market turns correct recognition grows and the probability of unreliable signals receipt goes down.
4. An auxiliary indicator with the use of estimations of maximal interval of the price graph autocorrelation allows to promote reliability of the generated trade signals.
Literature used
1 Eric L. Naiman Encyclopaedia for Traders — 1999. — 236 p.2 Steven Achelis "Technical Analysis from A to Z" // http://trader-lib.ru/28.html
3 Forex market // http://www.dealingcity.ru/ru/info/forex/book.htm